Data & BI
- Power BI
- Tableau
- QlikView
- Qlik Sense
- DAX
- Excel (Advanced)
- VBA
About me
Data · BI · automation · dashboards

Business Administration graduate; first serious work with Excel and PowerPoint in sales, then covering finance—where I automated closing-to-payroll so teams could pay by the second business day instead of ~15 days after month-end. That path led to Financial & Administrative Supervisor, a move to the state capital, and later Administrative Manager, with Advanced Excel and SQL along the way.
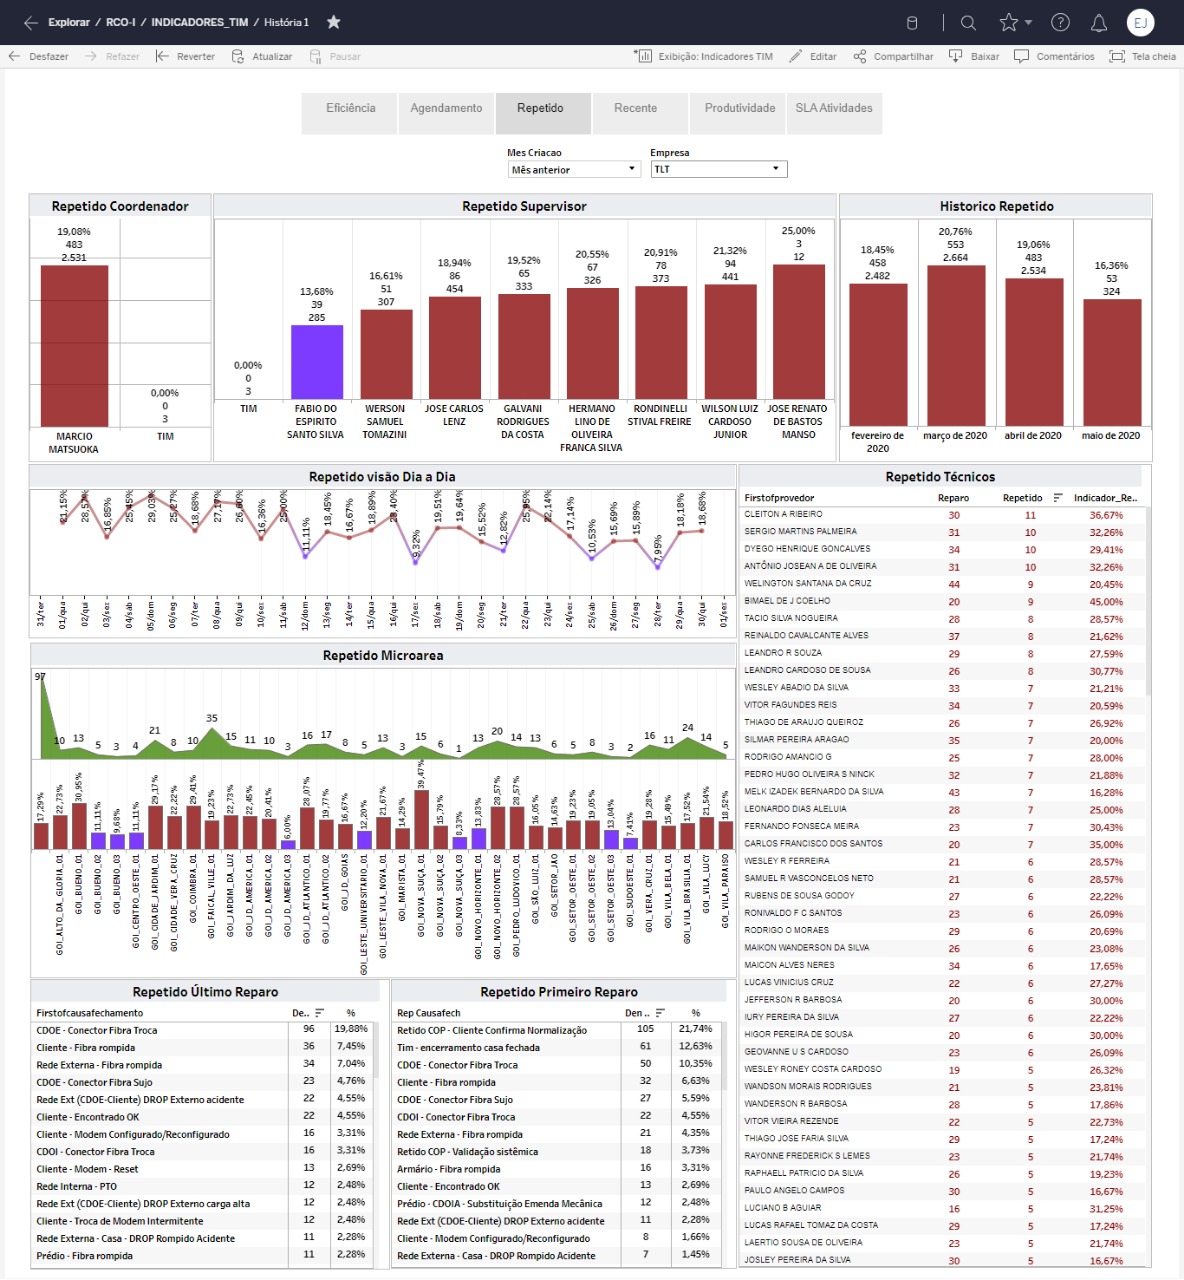
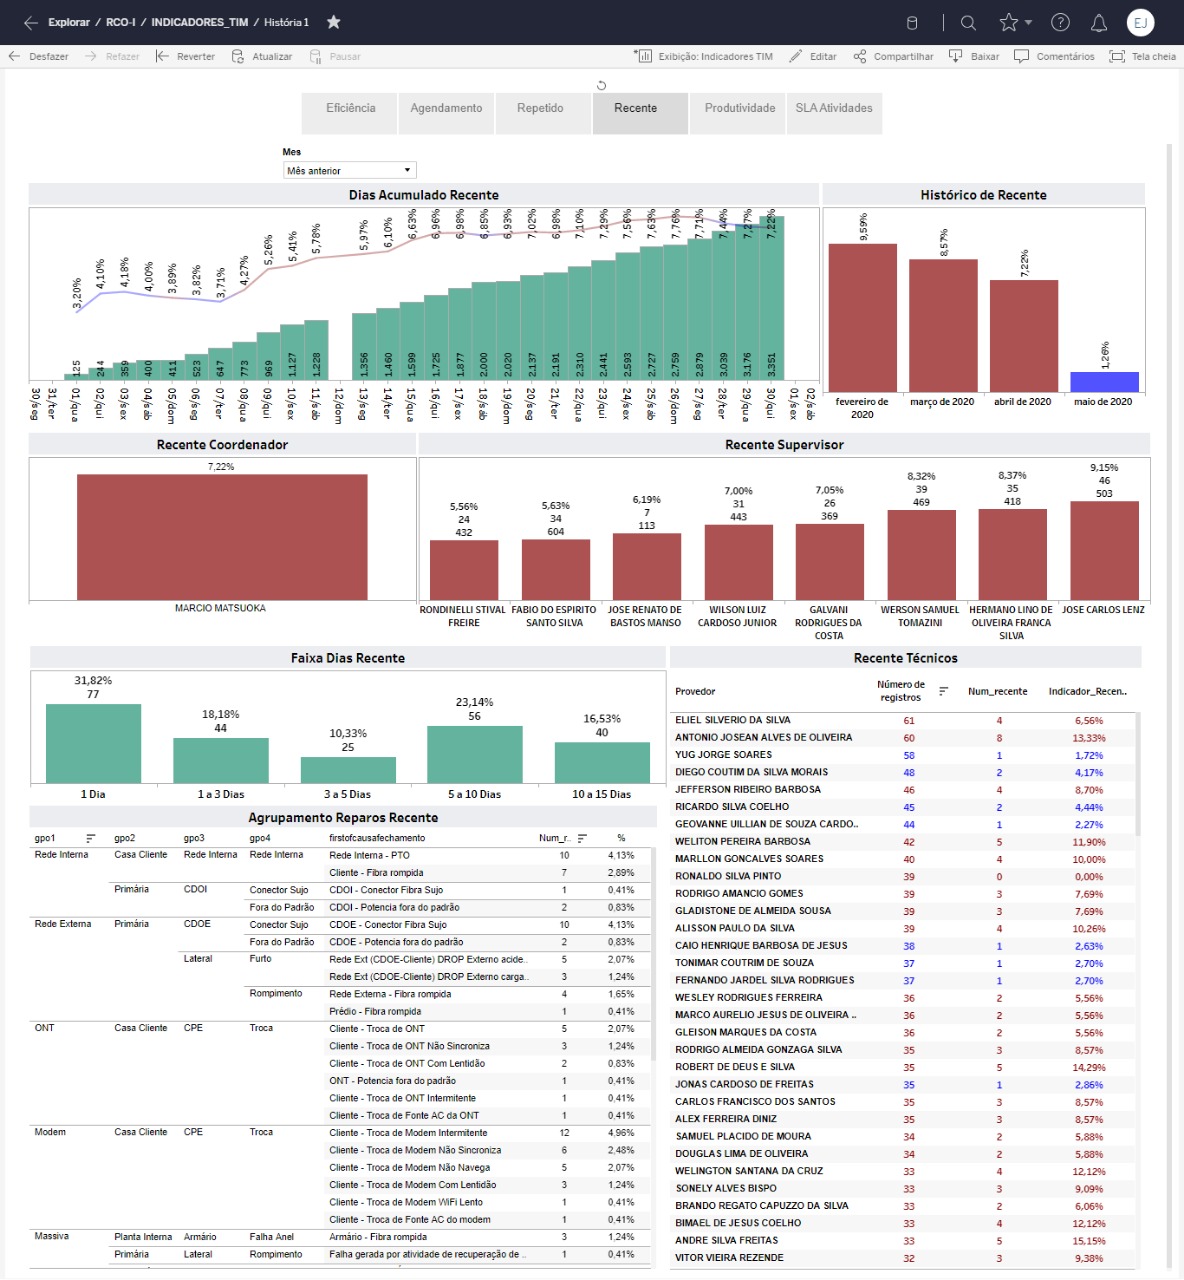
When the branch closed, I stayed in the city and joined Telemont as a Data Analyst, shaping processes, indicators, and KPIs. I kept levelling up on Power BI, Tableau, Qlik, Python, DAX, plus Agile, Scrum, and Six Sigma, and delivered data work for clients such as TIM, Oi SA, and Personal Energia. Oi SA then hired me as Senior Data Analyst (quality, finance, sales) alongside partners like IBM and Accenture, including heavy ELT and database centralisation.
I’m now in Australia, still learning fast when the problem demands it—for example picking up enough front-end skills to ship a TIM KPI web showcase. I’ve been promoted early, hired by a major client for performance, and I care about balance while taking on the next challenges.
Current: Data Analyst at Bustle Tech (Perth — transport, logistics, and supply chain), and counting. Day to day: Qlik, PostgreSQL, MongoDB, Python, dashboards and reporting, exploratory analysis via SQL/APIs, data cleaning and automation, working with BAs, product, and stakeholders in Agile on Jira.
Snapshot of how I ship work: BI stacks, light coding for pipelines and static apps, and delivery habits from telecom, energy, and logistics projects.
Public dashboards I built end-to-end: Python pipelines to JSON, static front ends on GitHub Pages (no login). Click a card to open the live site—IMMI_DATA (migration stats) and Perth Property Data (sold-property analytics).
Tap a card to open the live app on GitHub Pages (new tab).
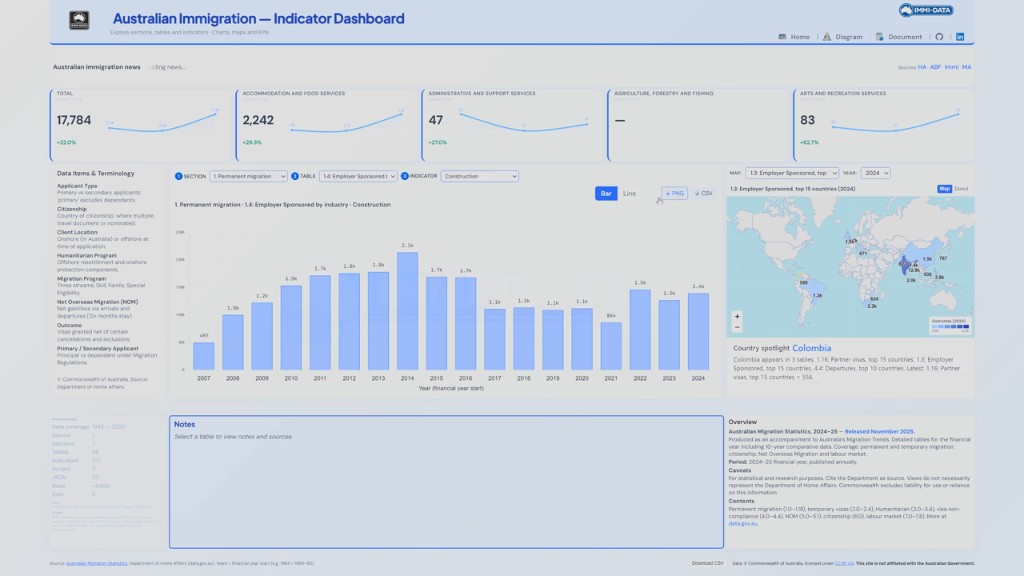
Public dashboard for official Home Affairs migration statistics (data.gov.au). Explore when (year / quarter / month), from which country, and trends across years. The UI follows Section → Table → Indicator → Year; includes dynamic KPIs with YoY and sparklines, line/bar charts, a choropleth map and country donut, footnotes, and an indicator tree for all sections, tables, and indicators. Built from the XLSX package via a Python pipeline into static JSON for the front end (Chart.js, Leaflet).
jfilhorv.github.io/IMMI_DATA/dashboard/
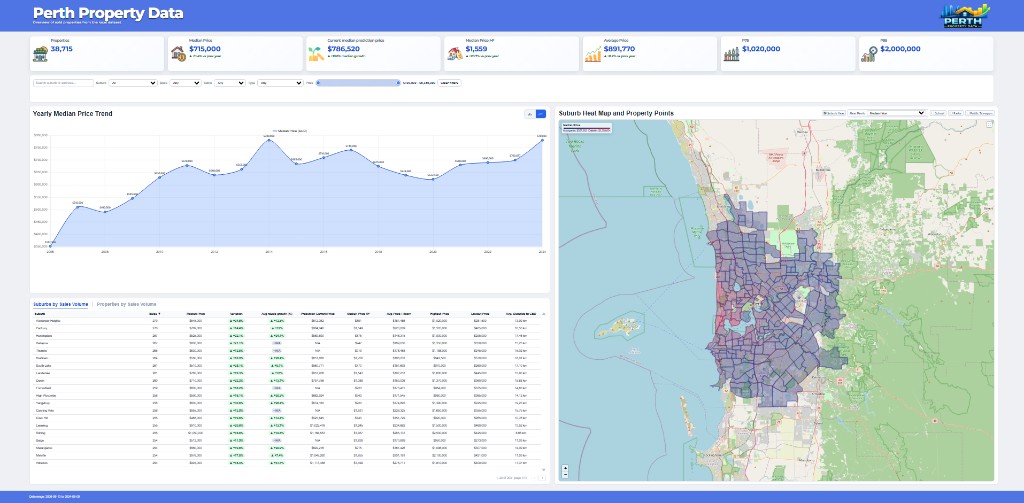
Perth sold-property analytics: a Python pipeline turns a CSV at the repo root into JSON for one static page. You get a KPI strip driven by filters, suburb / beds / baths / year and a dual-handle price range, a yearly median price chart (line or bar), a Leaflet map with suburb heat, points, optional parks, school estimates, and PTA transport when data exists, plus sortable suburb and property tables and a suburb-level distribution chart (Chart.js / Plotly). Plain HTML, CSS, and vanilla JS — no framework build step.
jfilhorv.github.io/perth_property_data/dashboard/
Source code lives on GitHub under the same username: repositories IMMI_DATA and perth_property_data (use the GitHub icon in the header if you need the exact URLs).
Power BI — star schema, visuals, and DAX measures for finance, sales, and quality reporting. Thumbnails from real delivery work; workbook-heavy pieces sit under Excel.
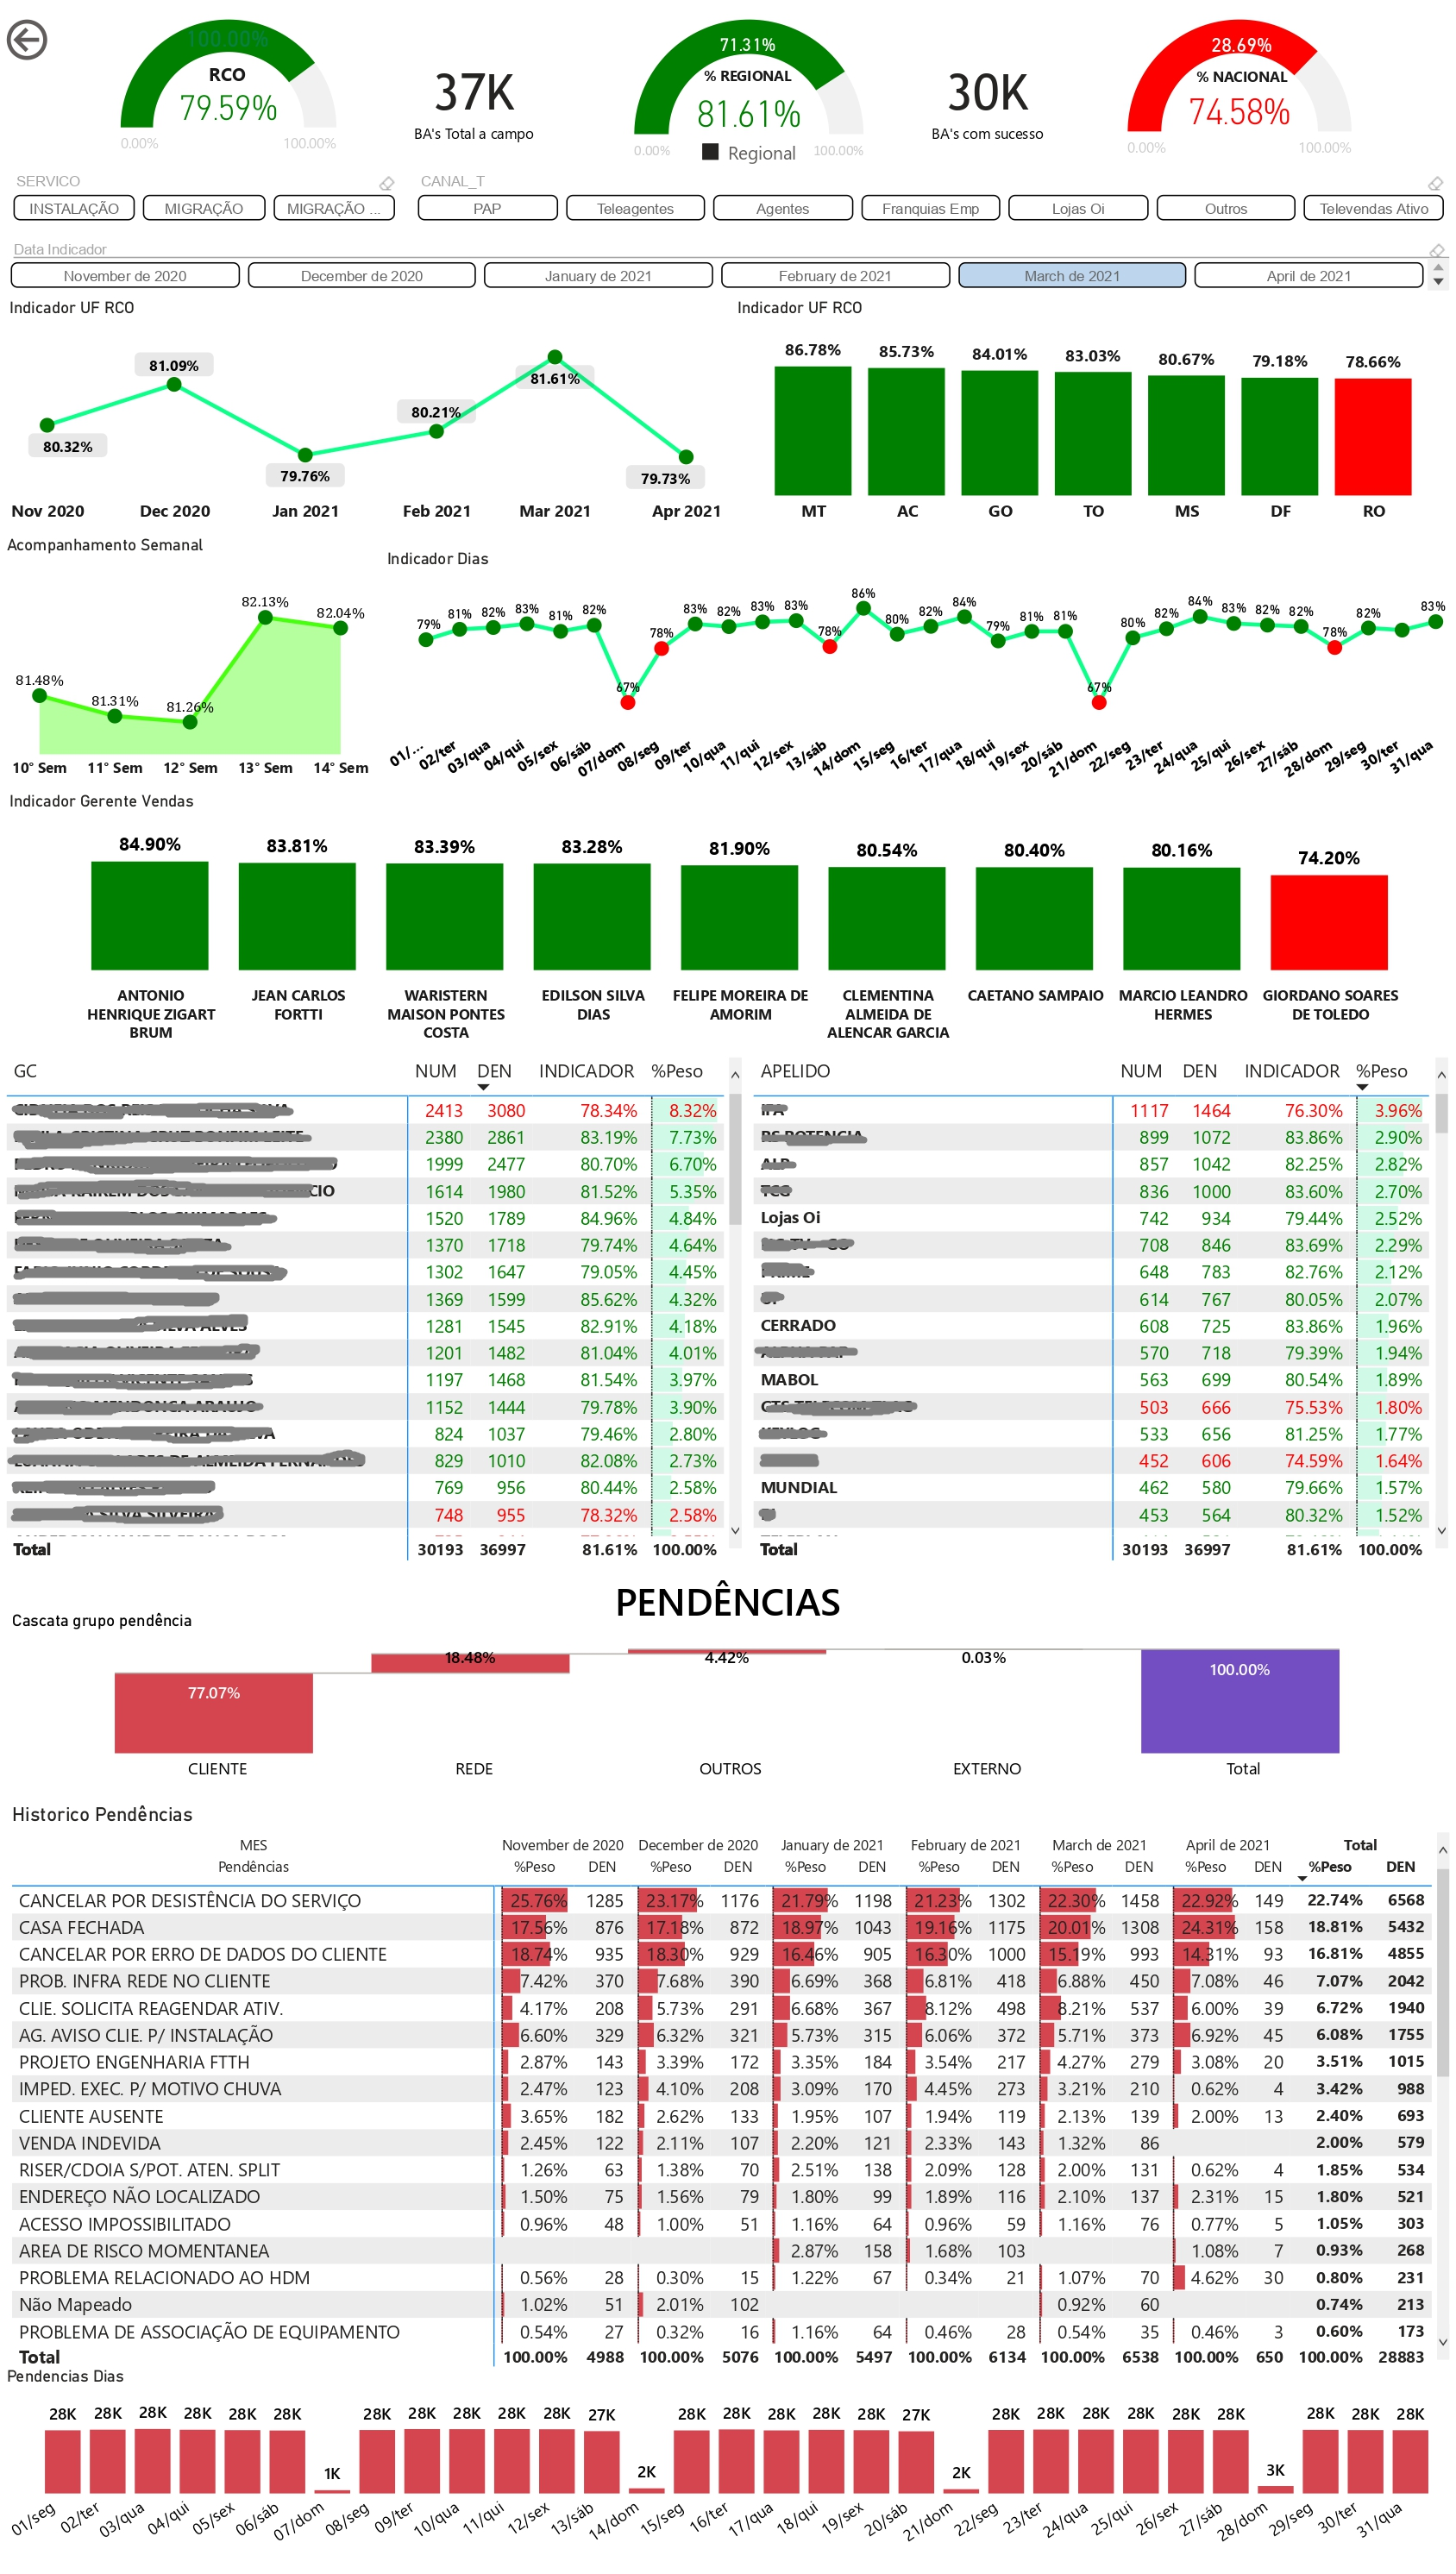
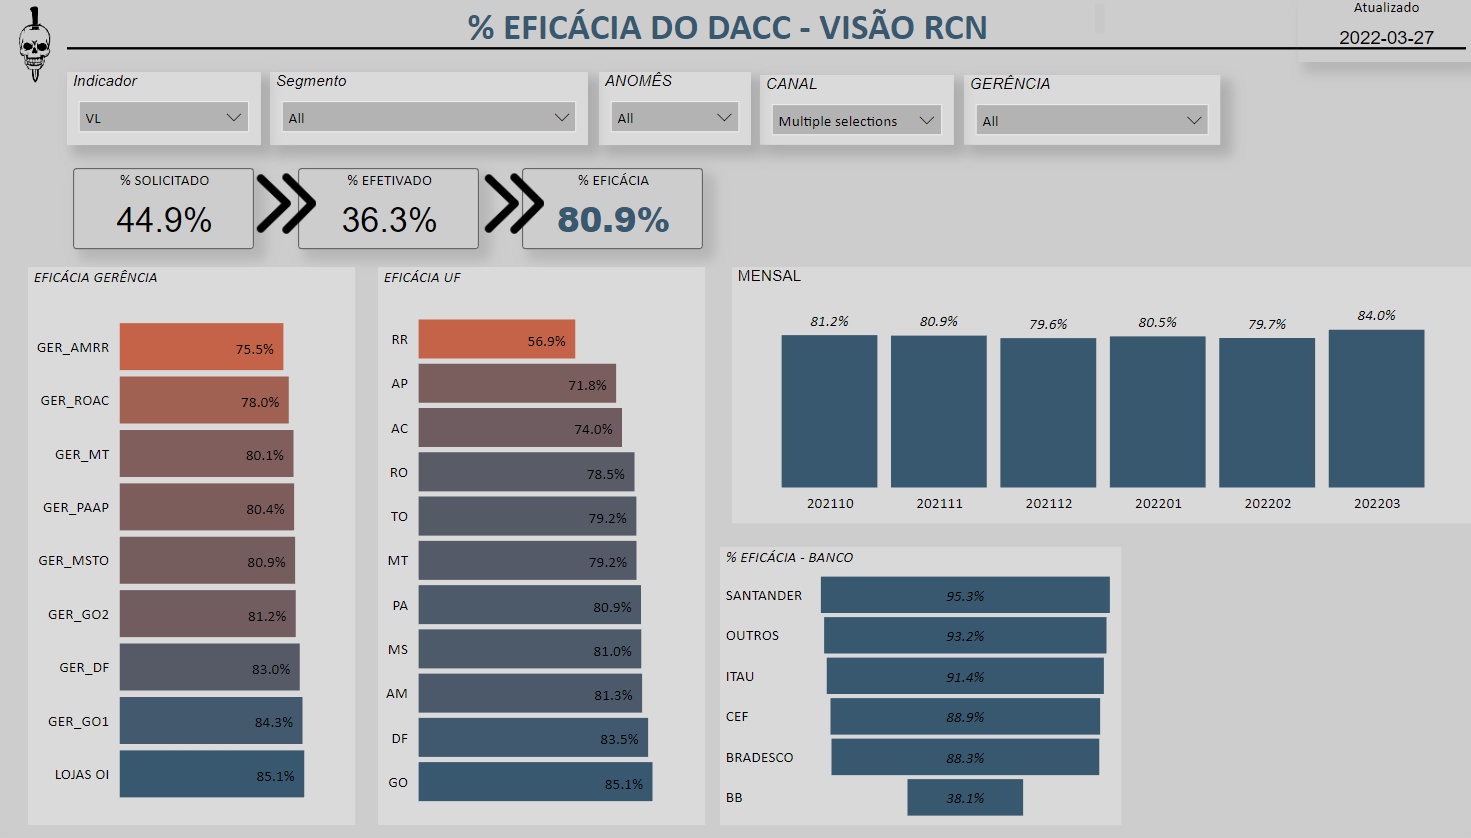
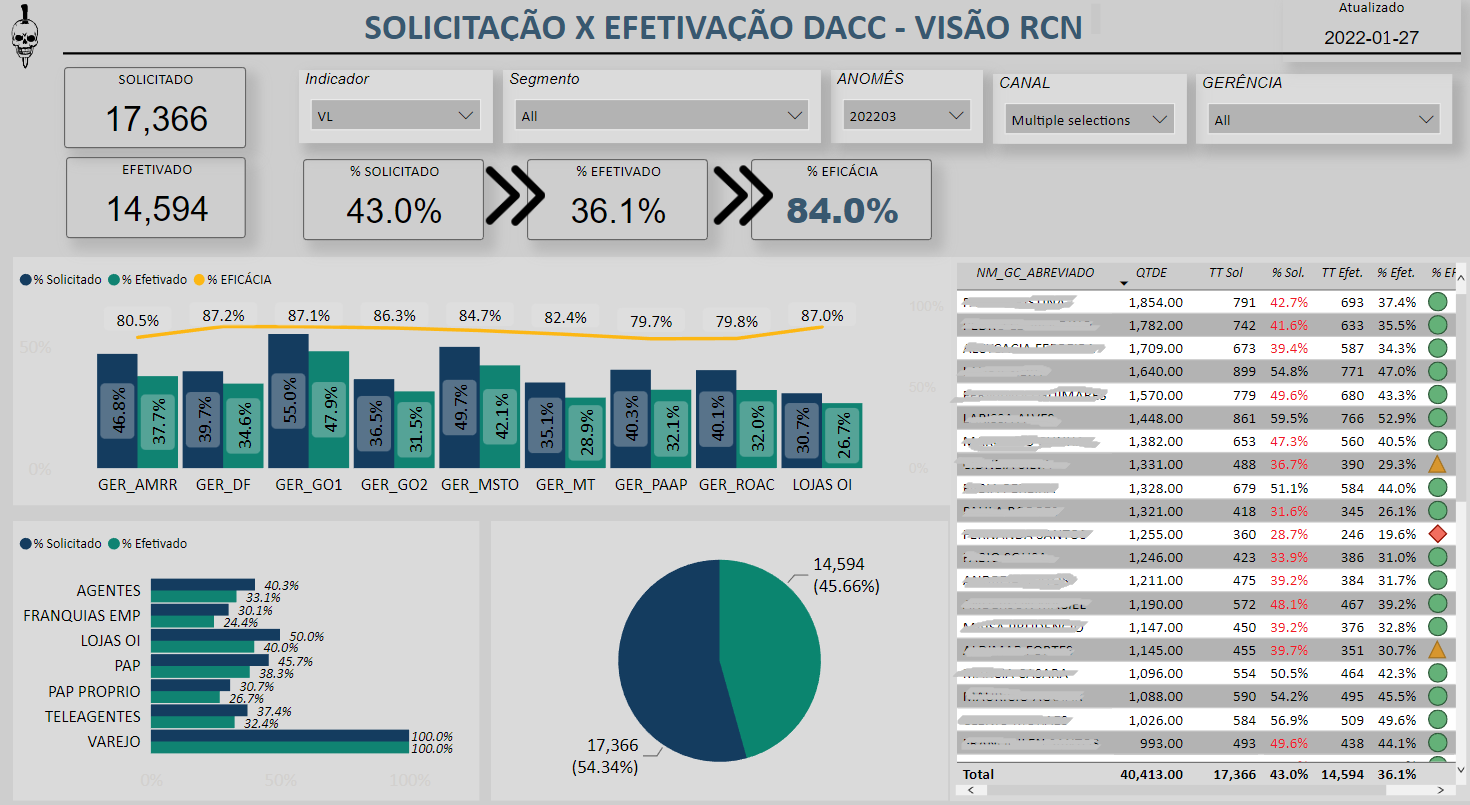
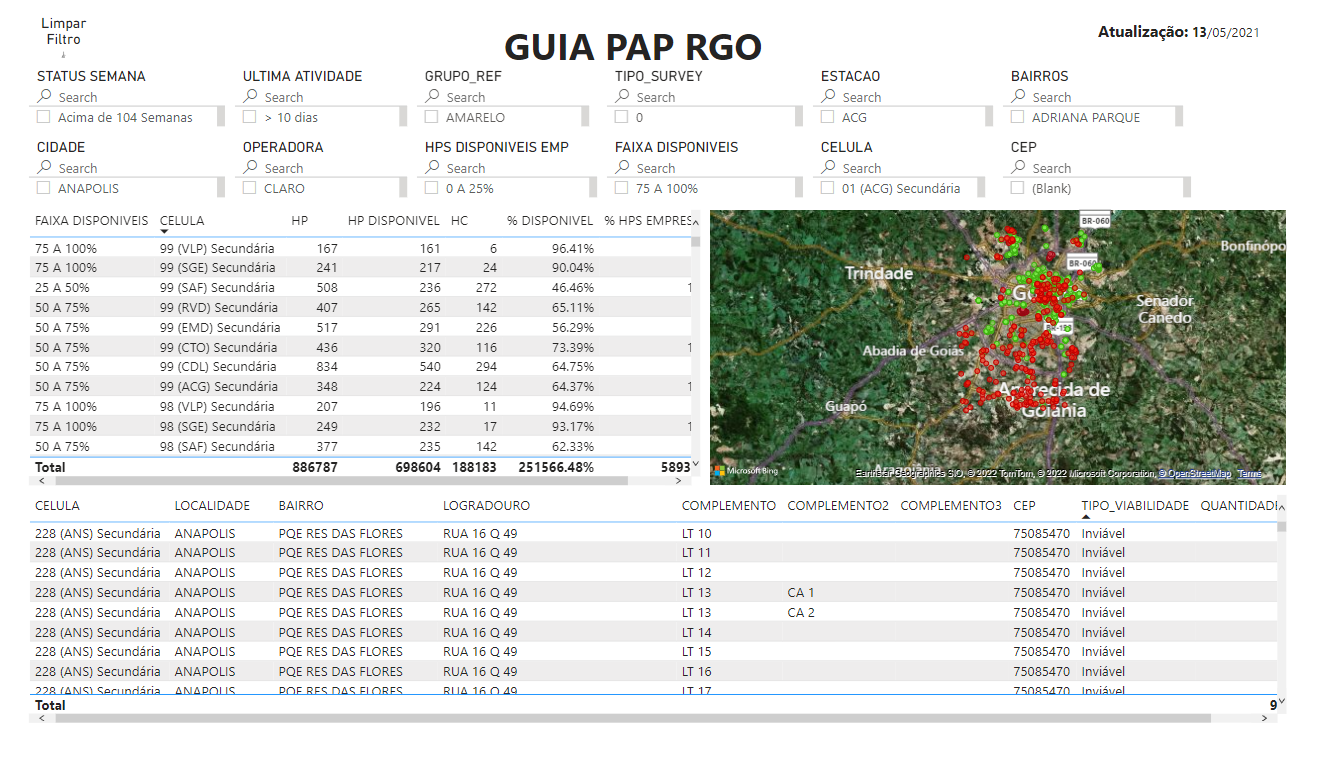
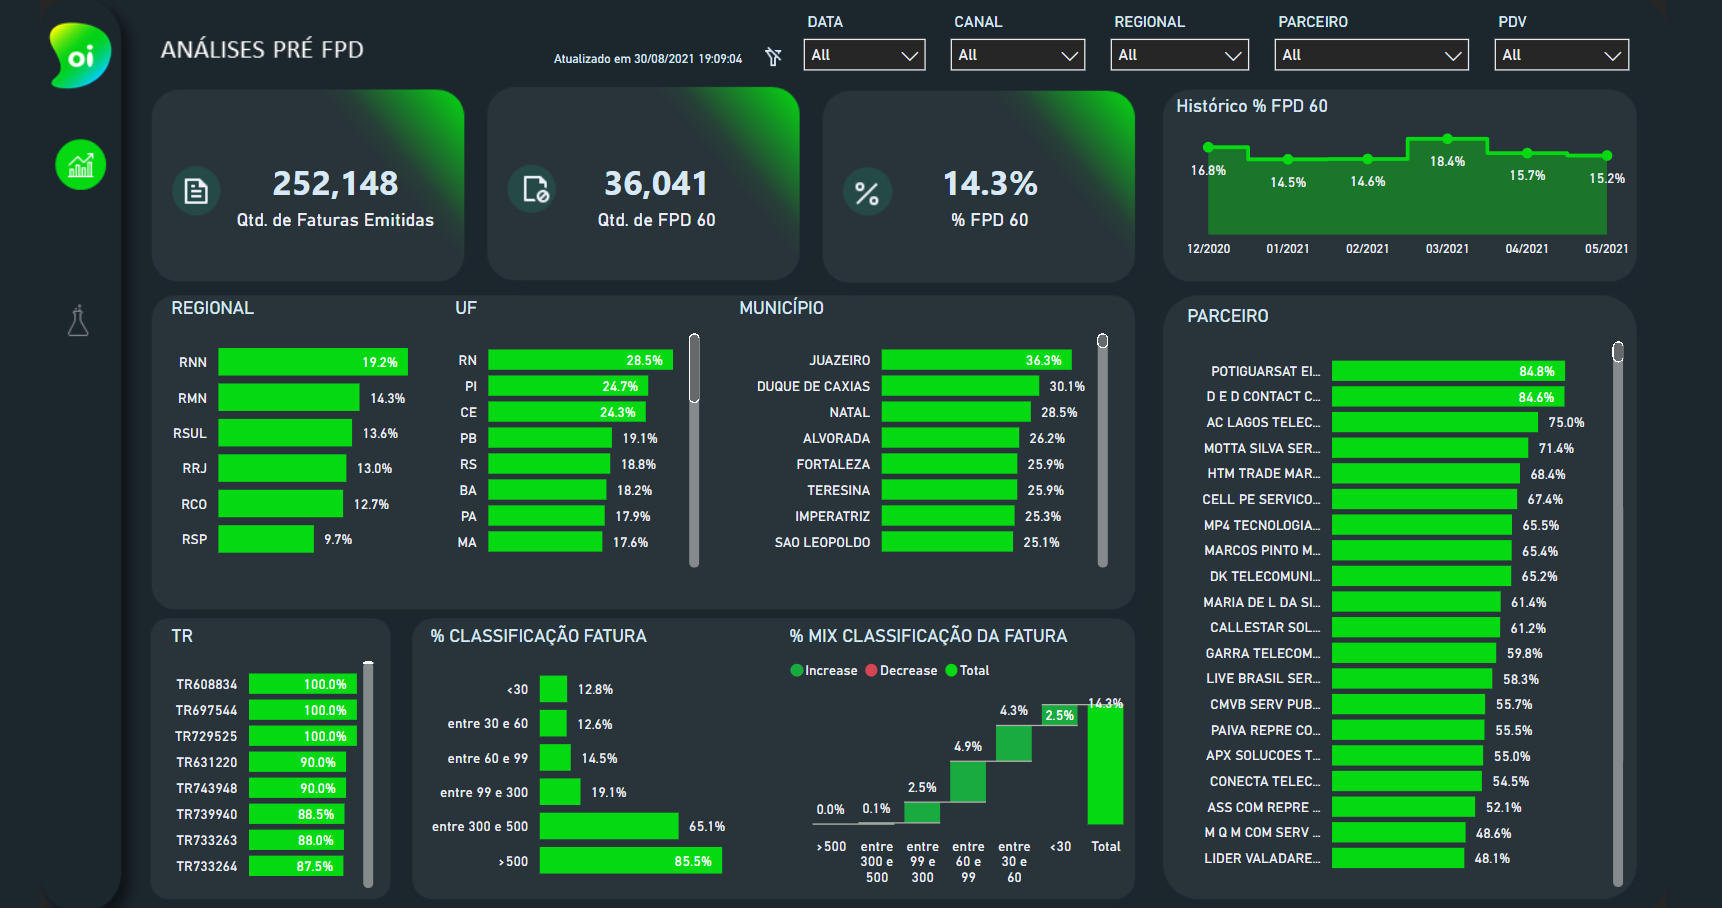
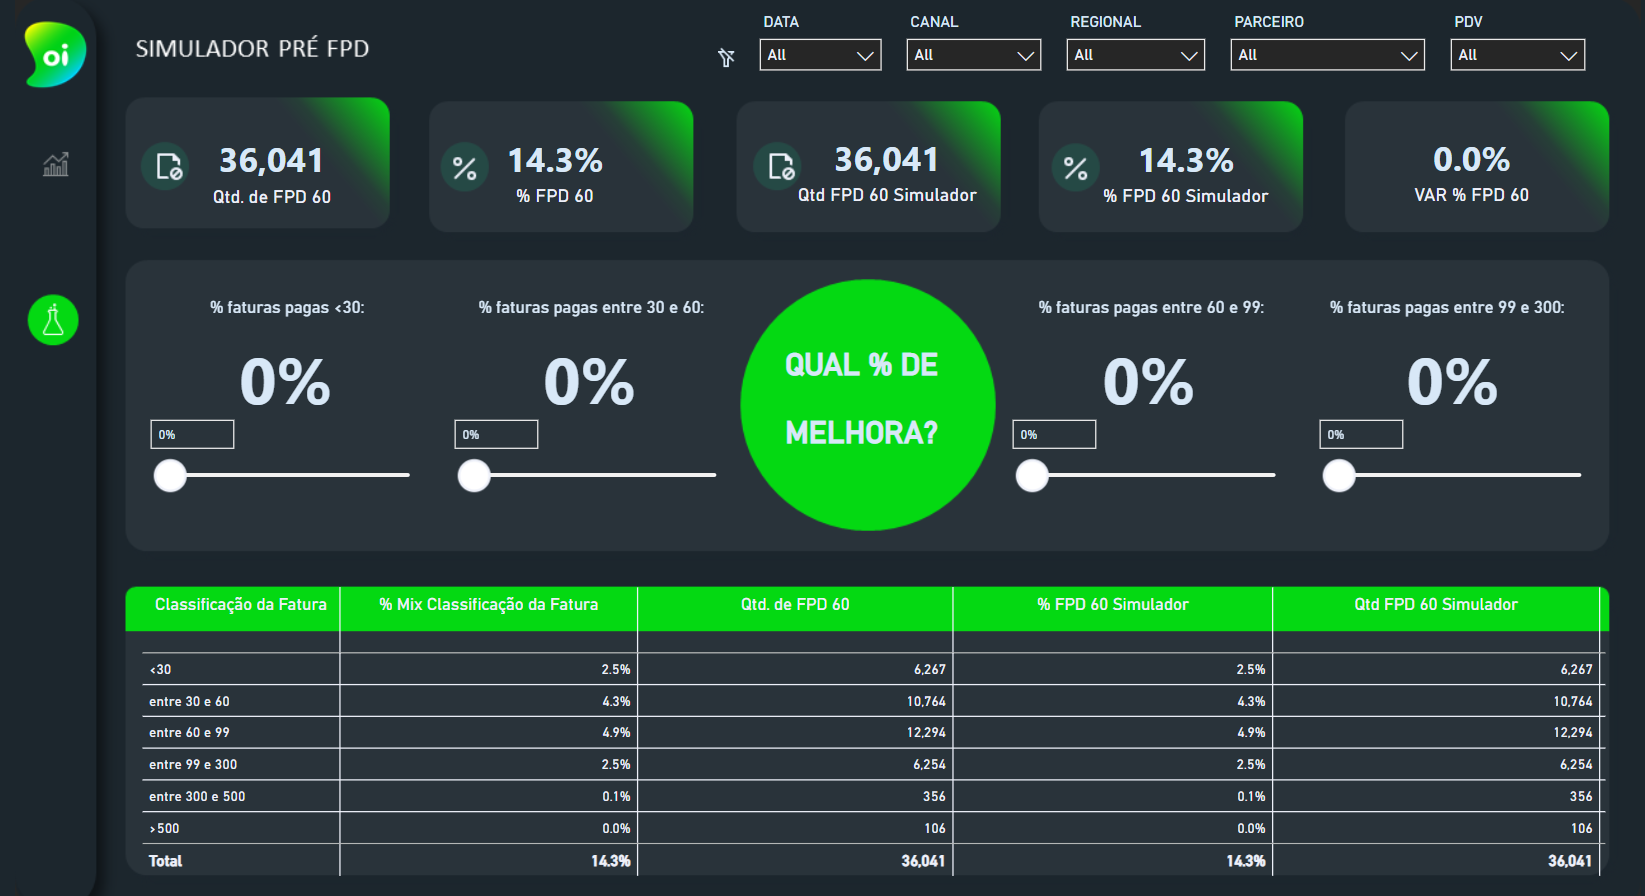
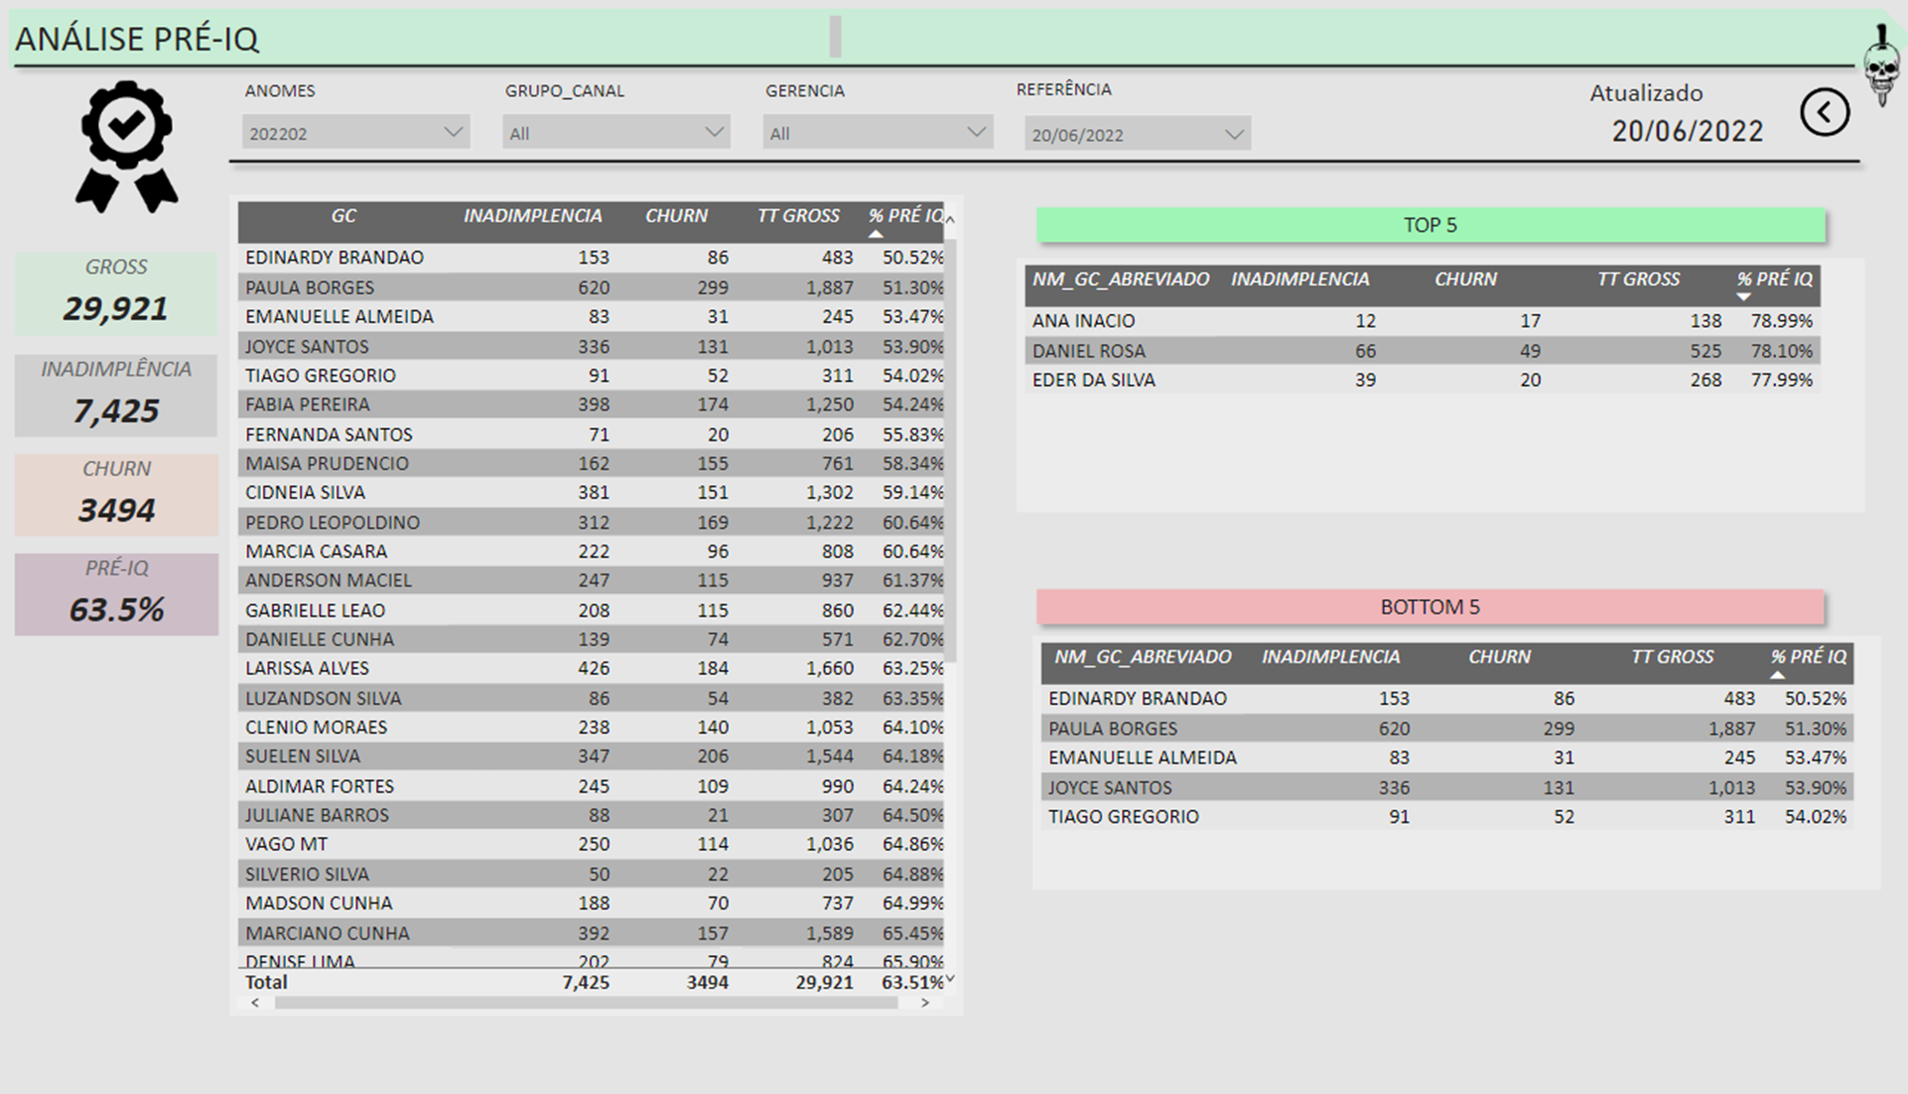
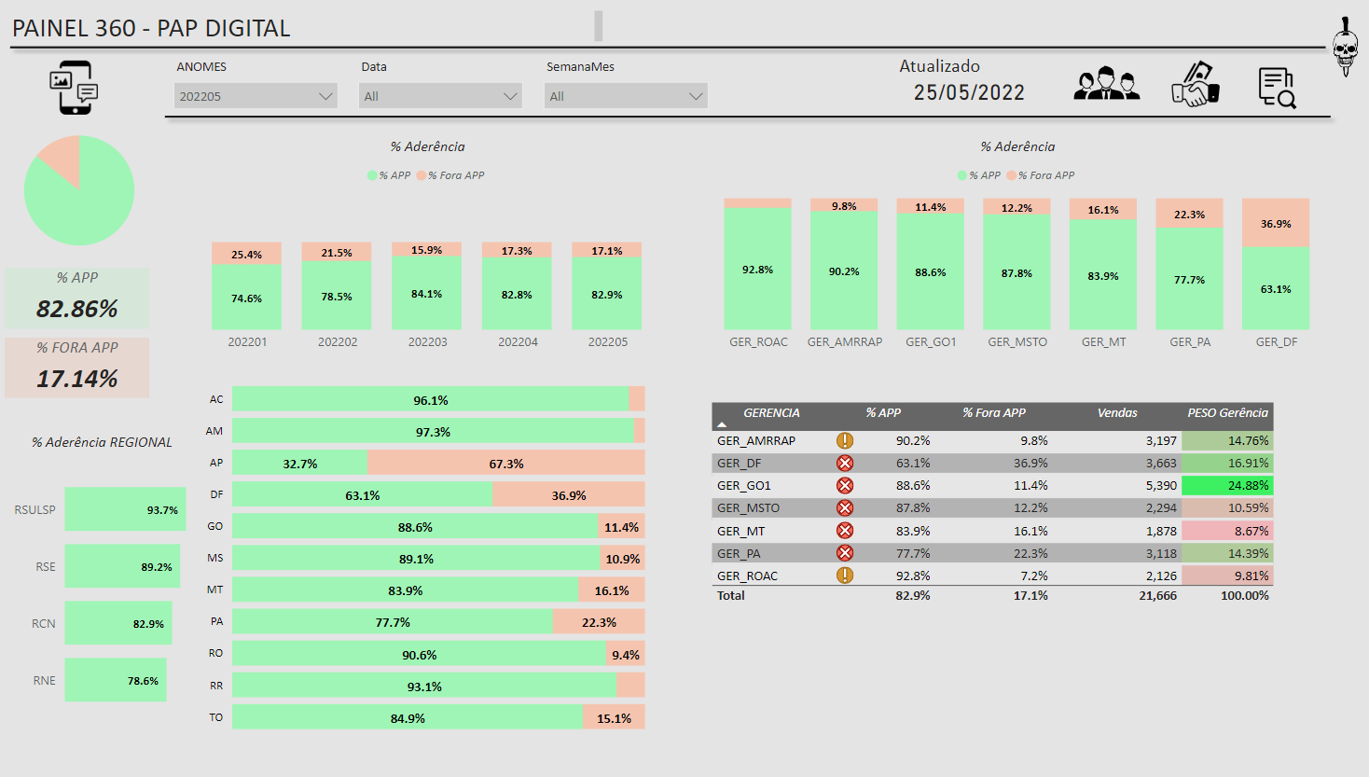
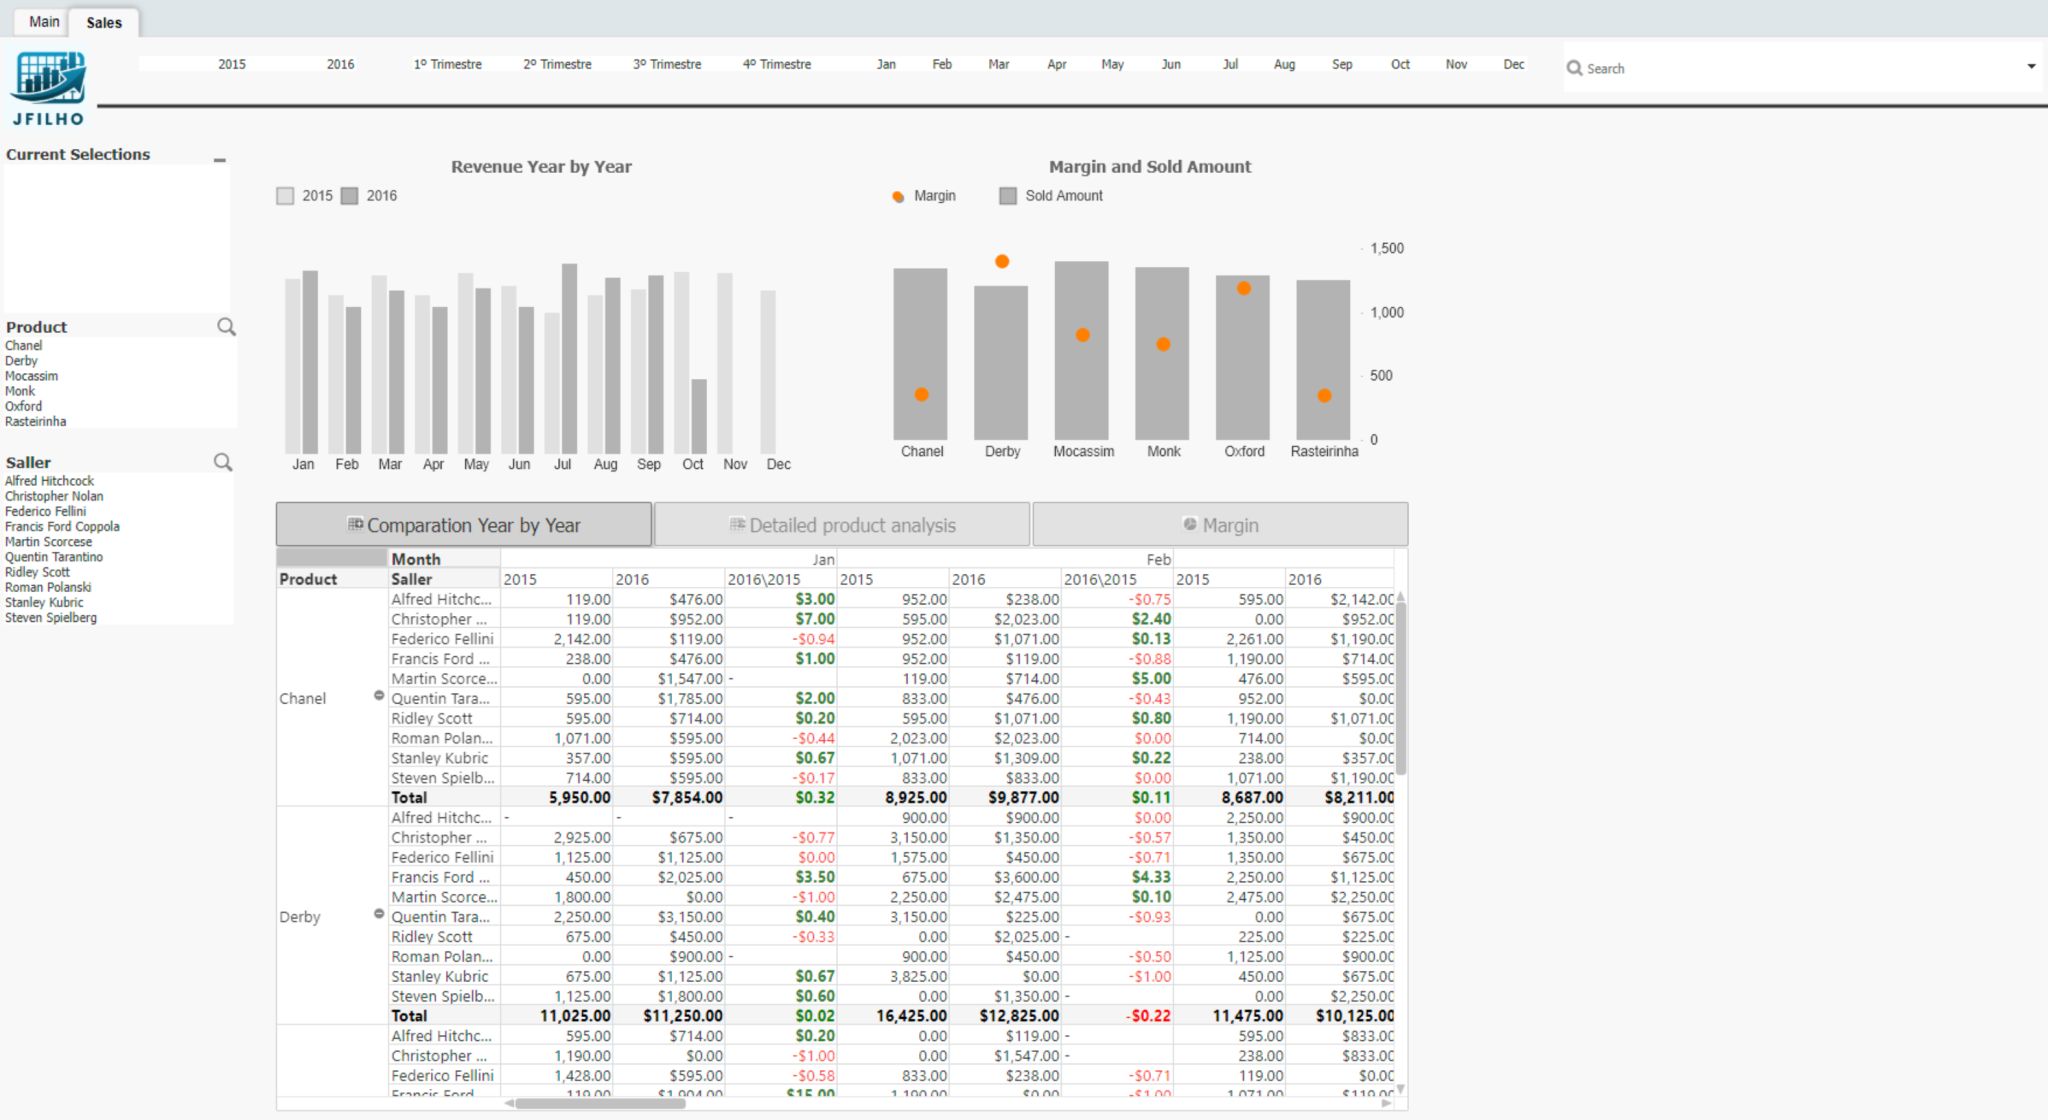
Tableau — calculated fields, parameters, and LOD-style logic for exec-ready views; samples from client-style workbook delivery.
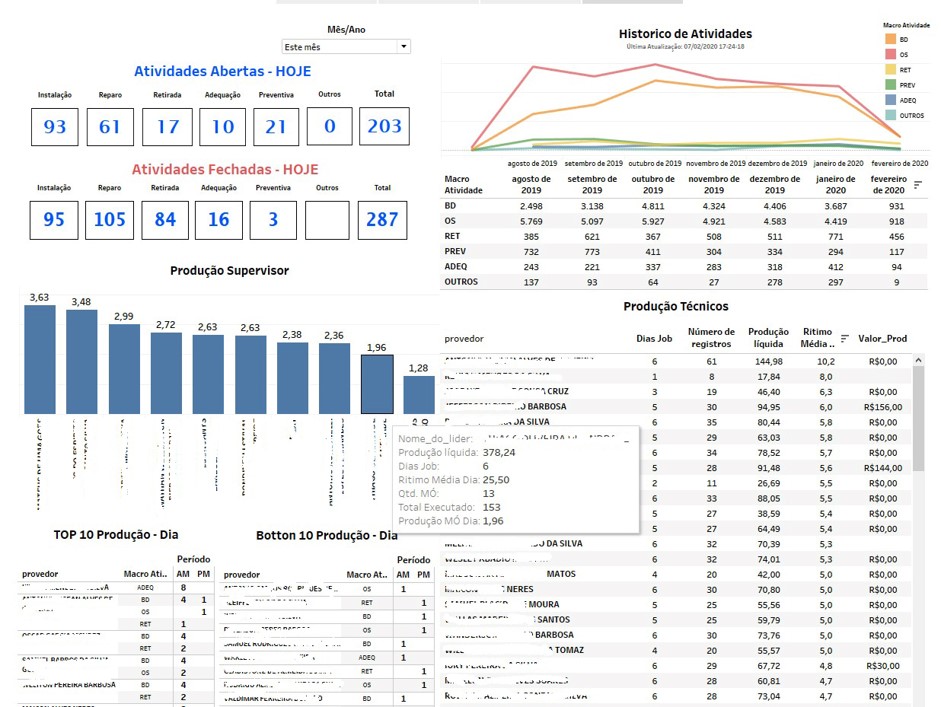
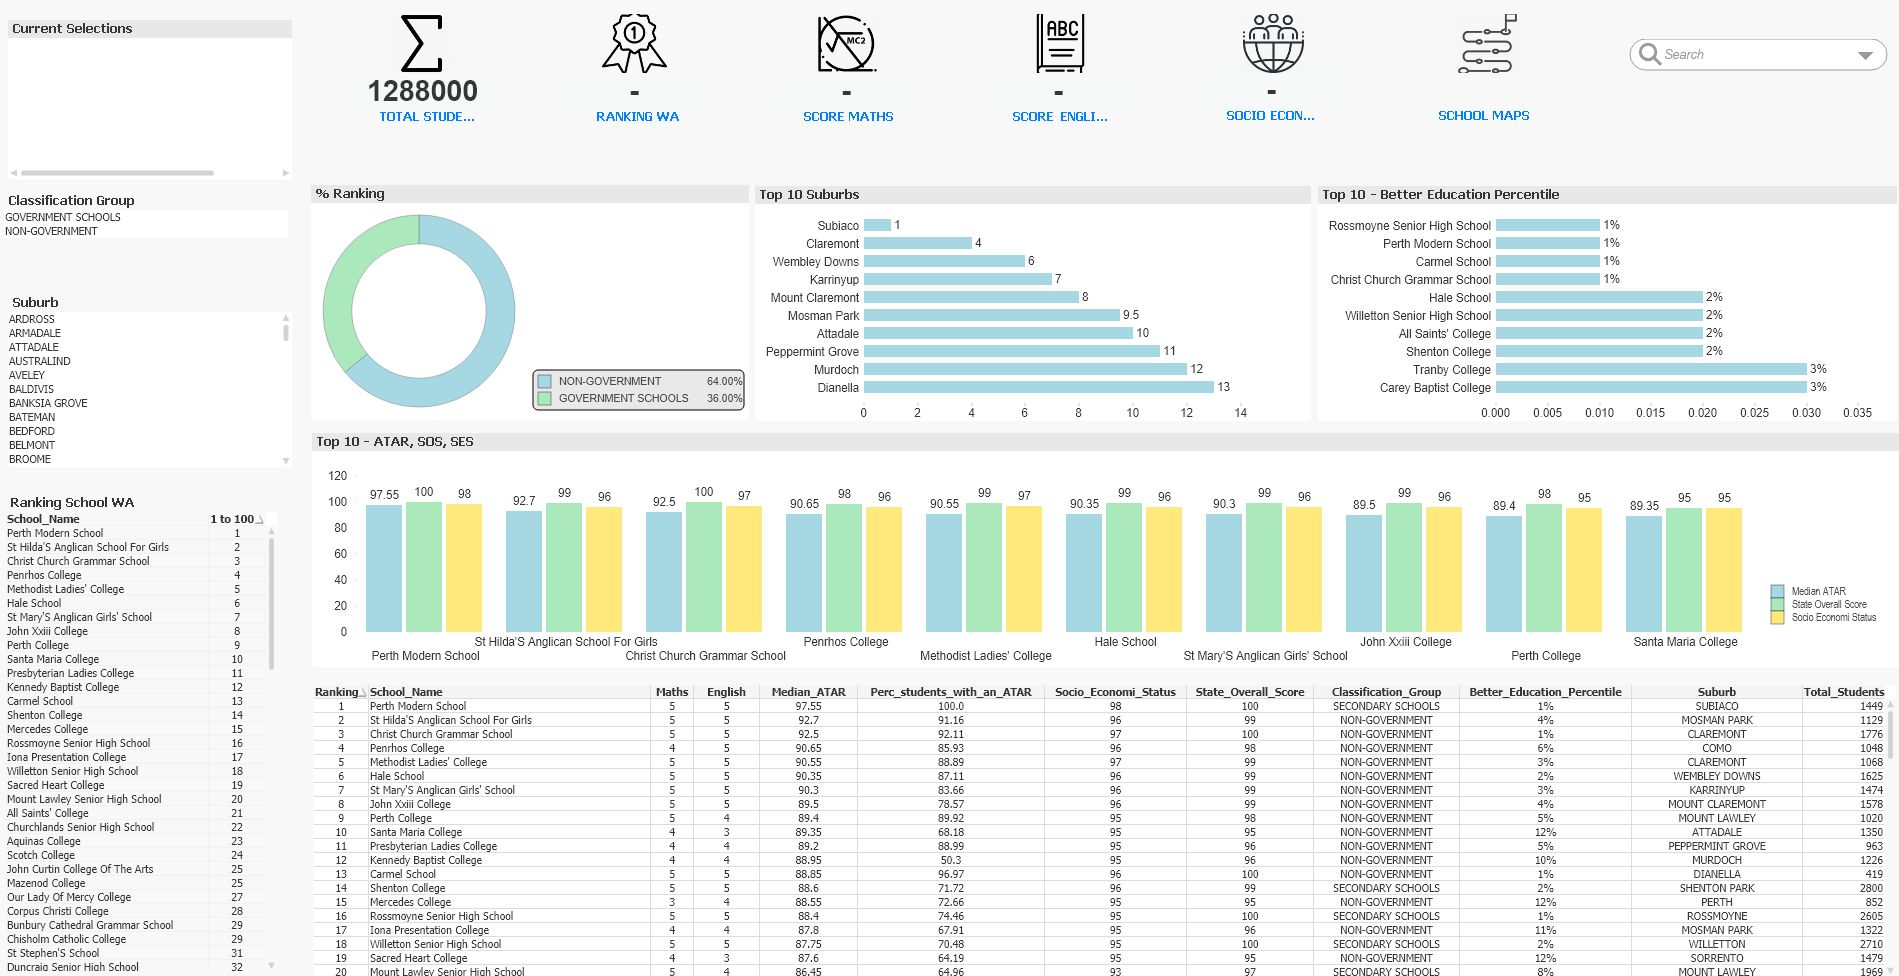
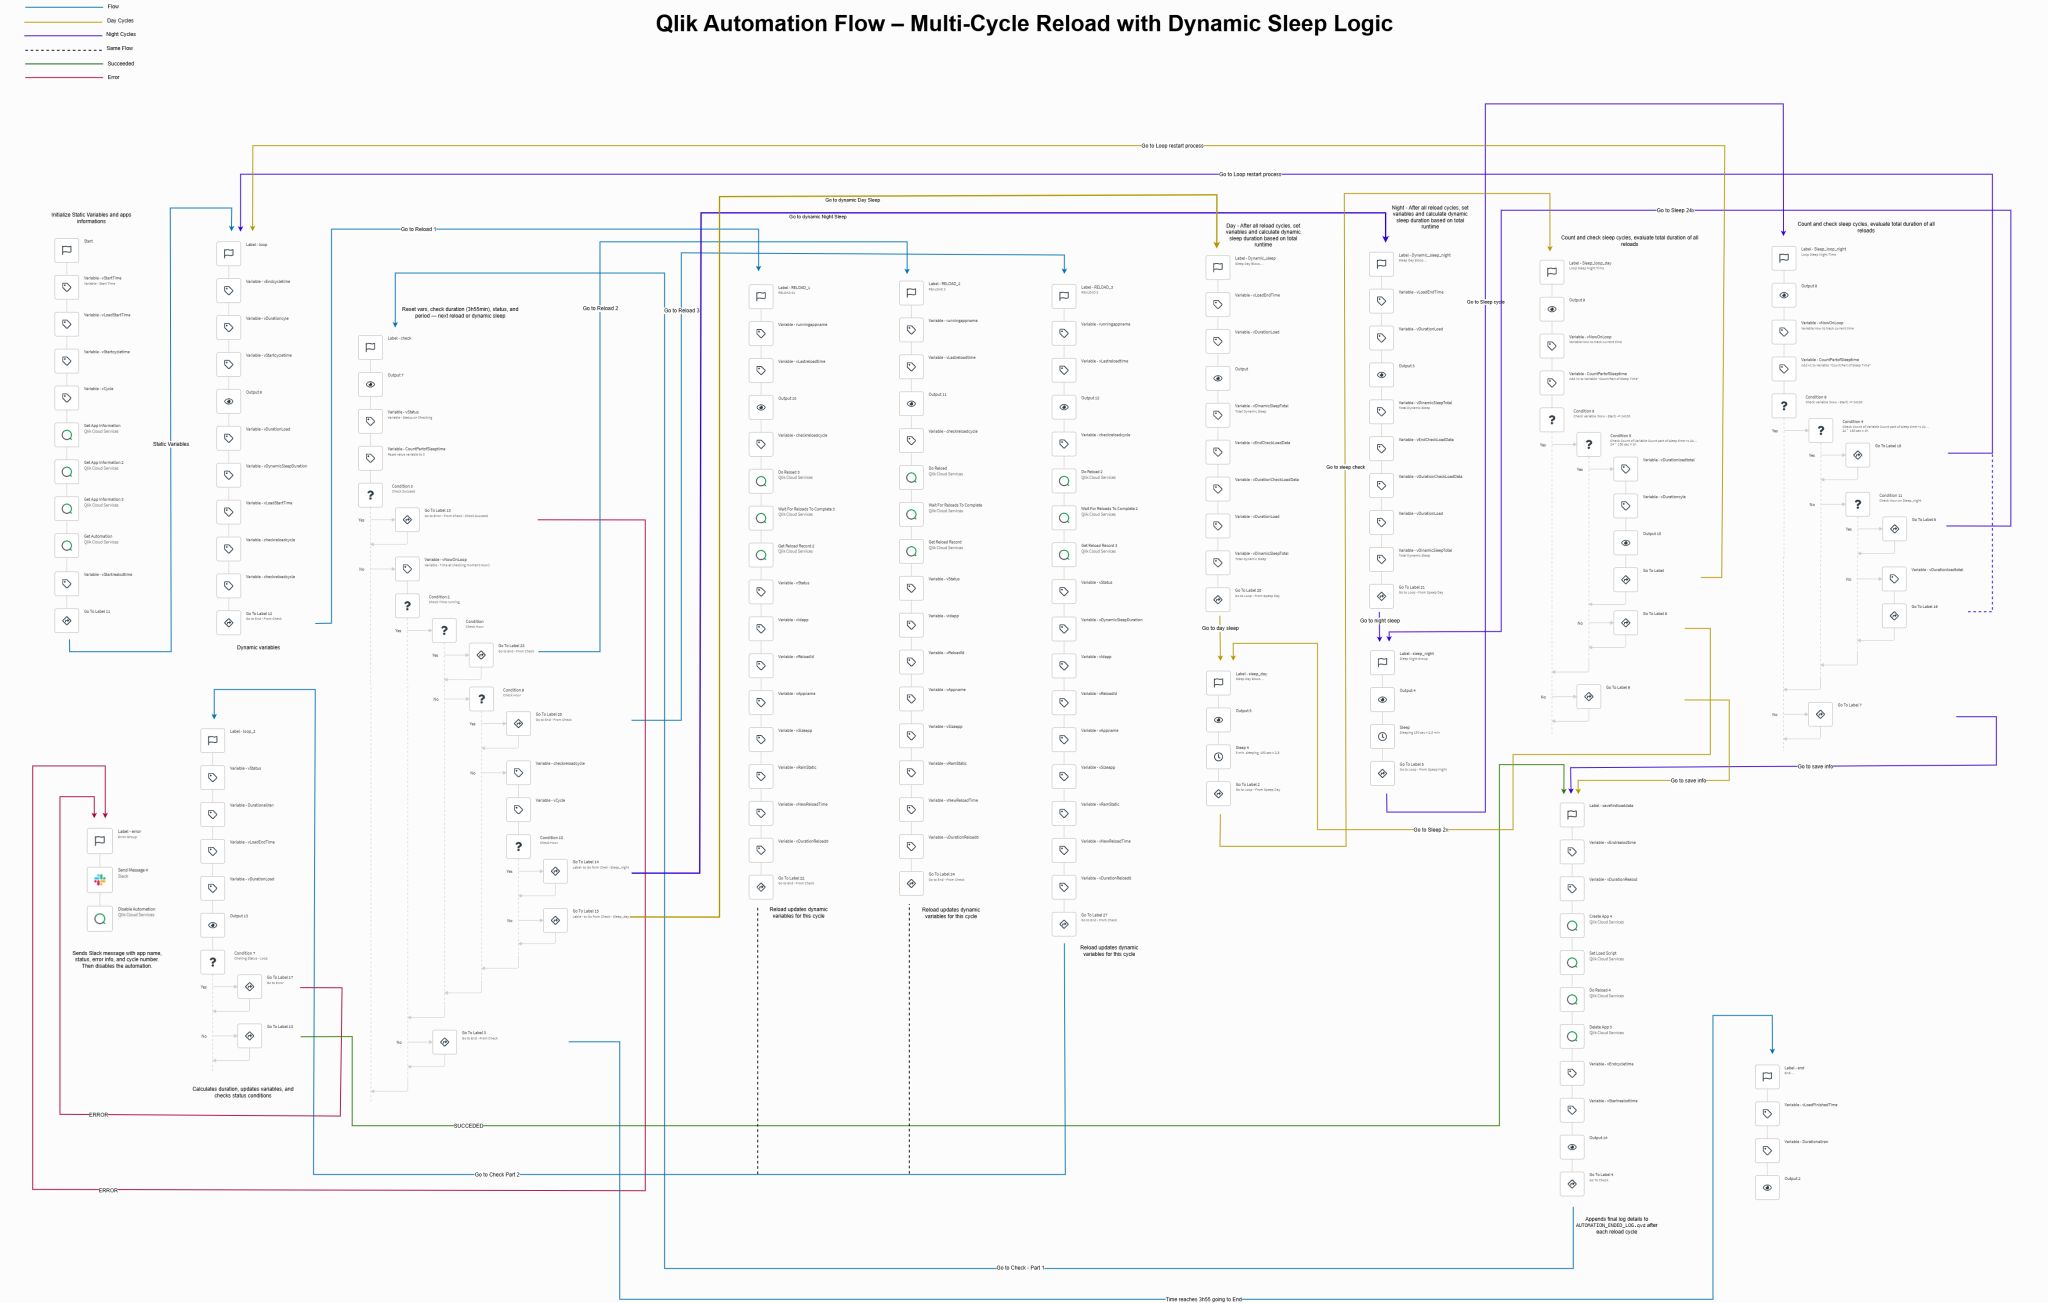
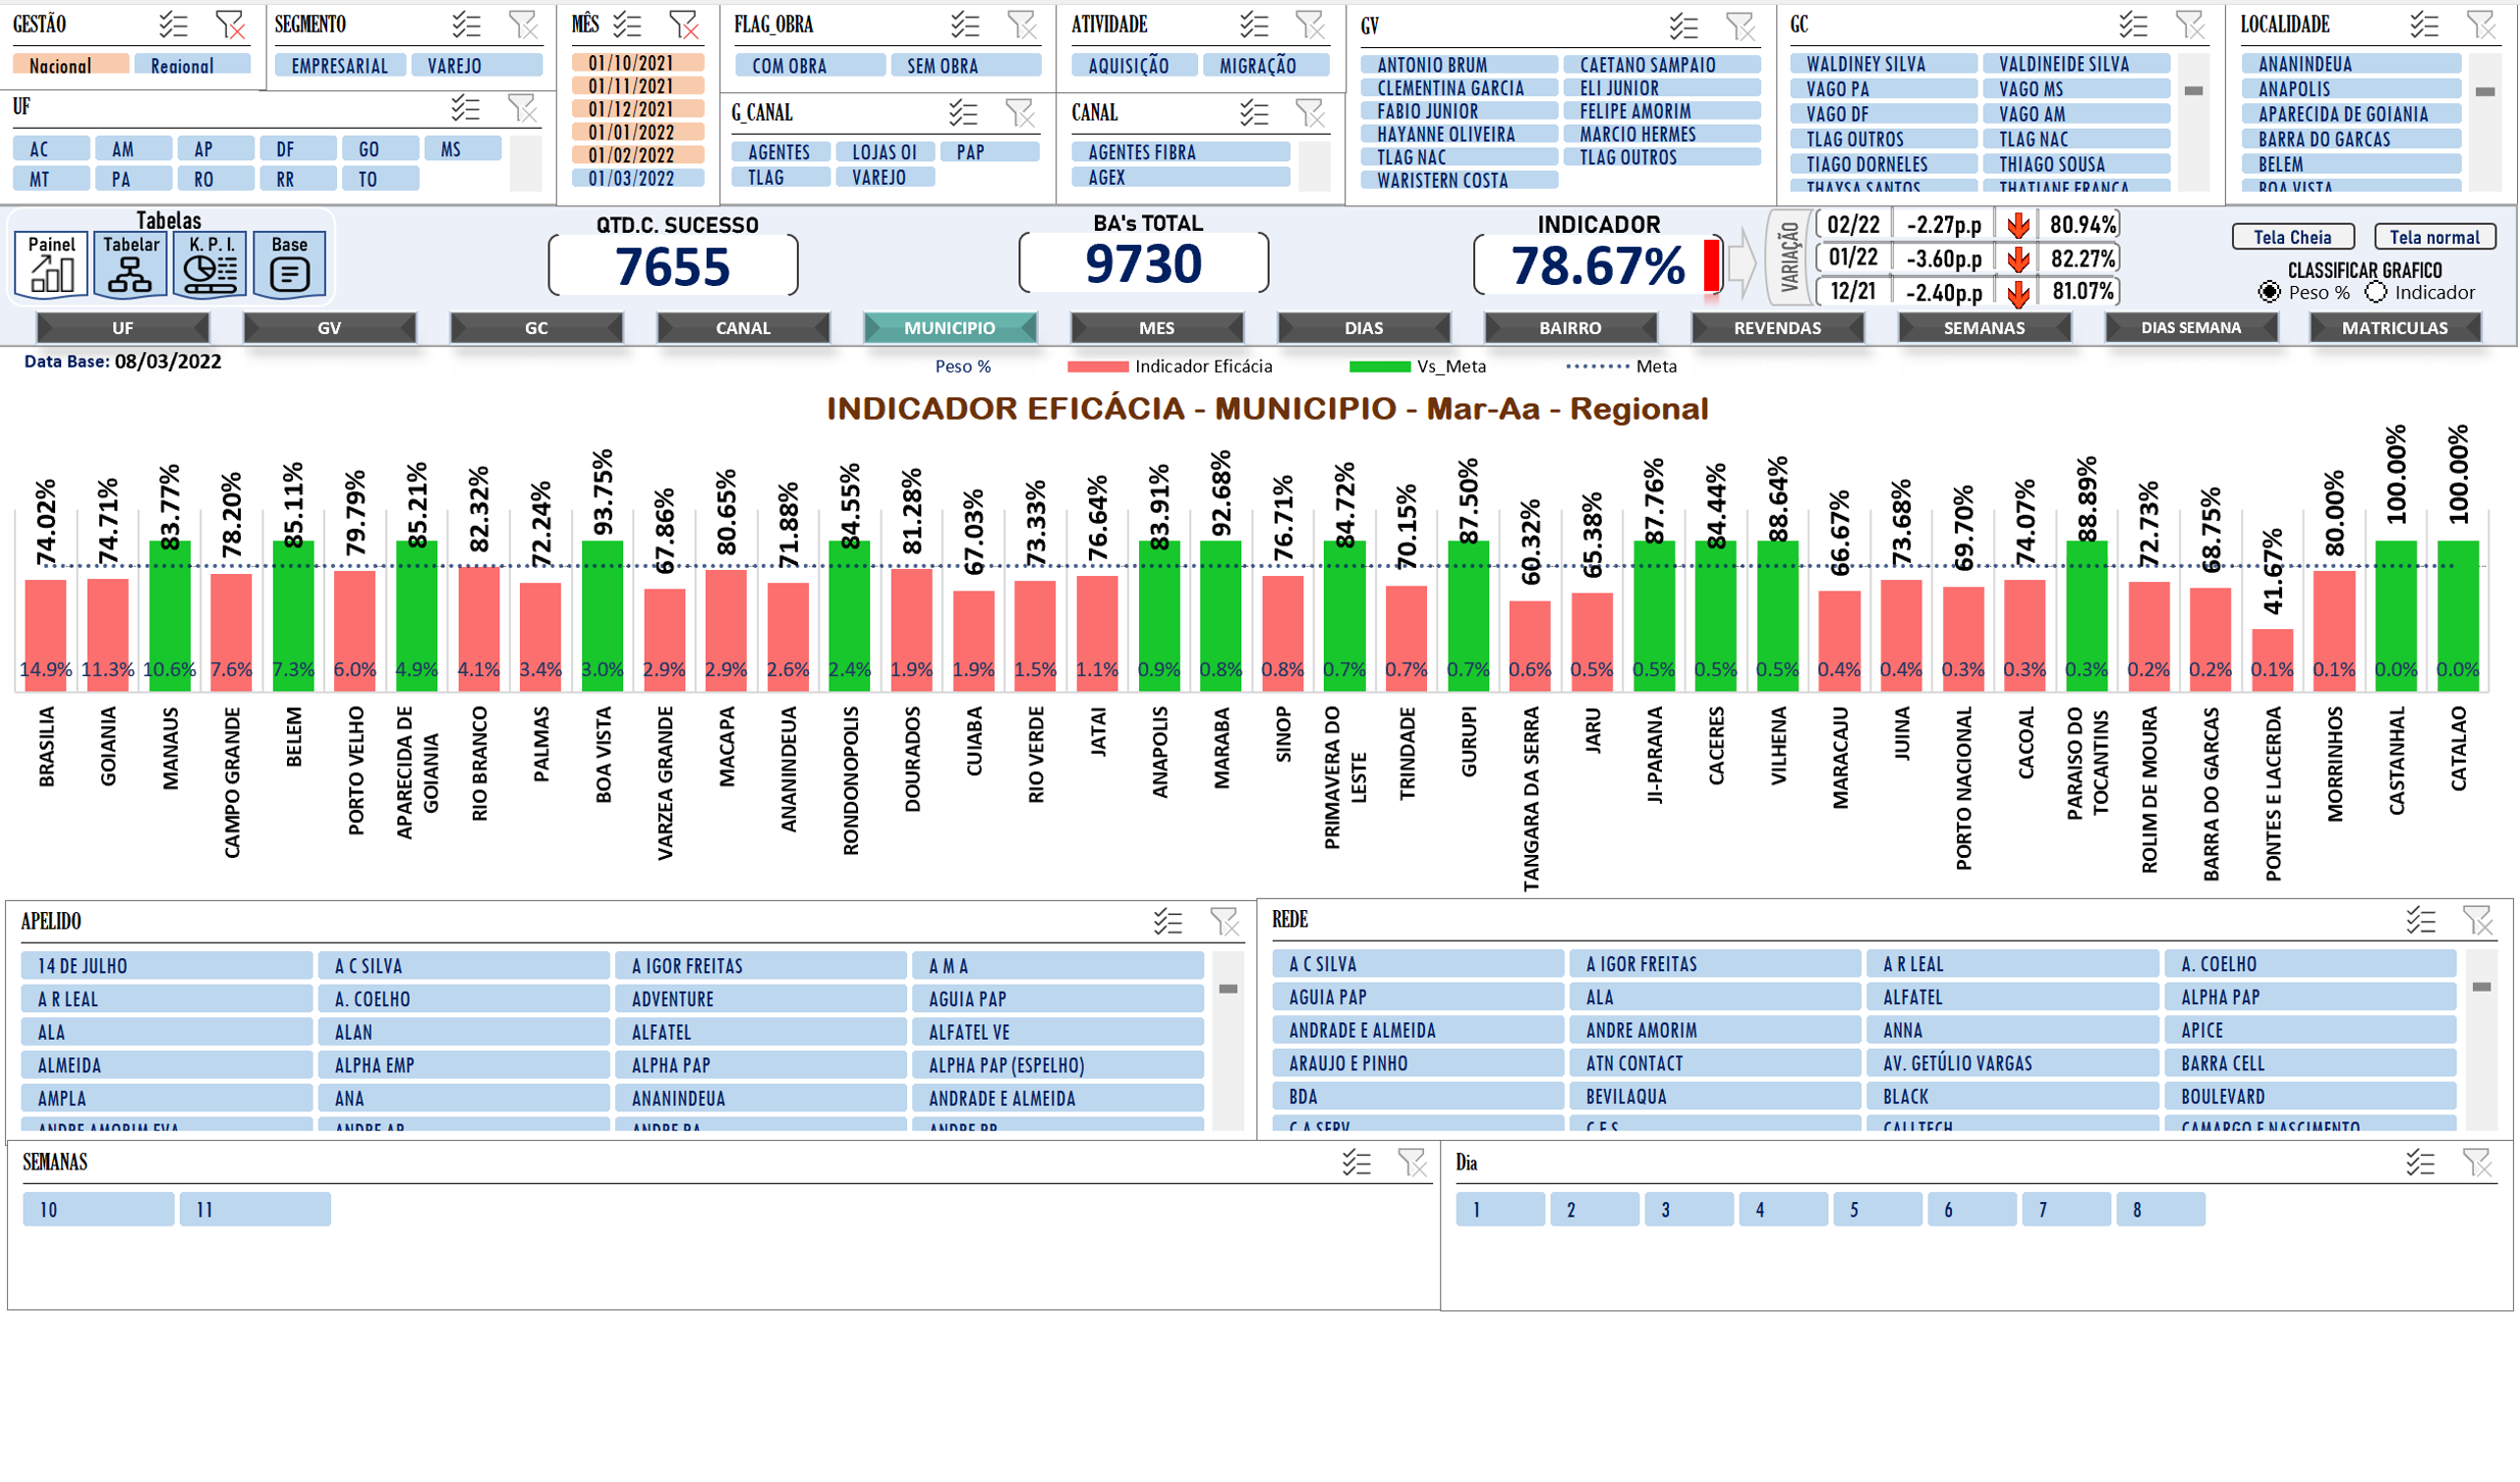
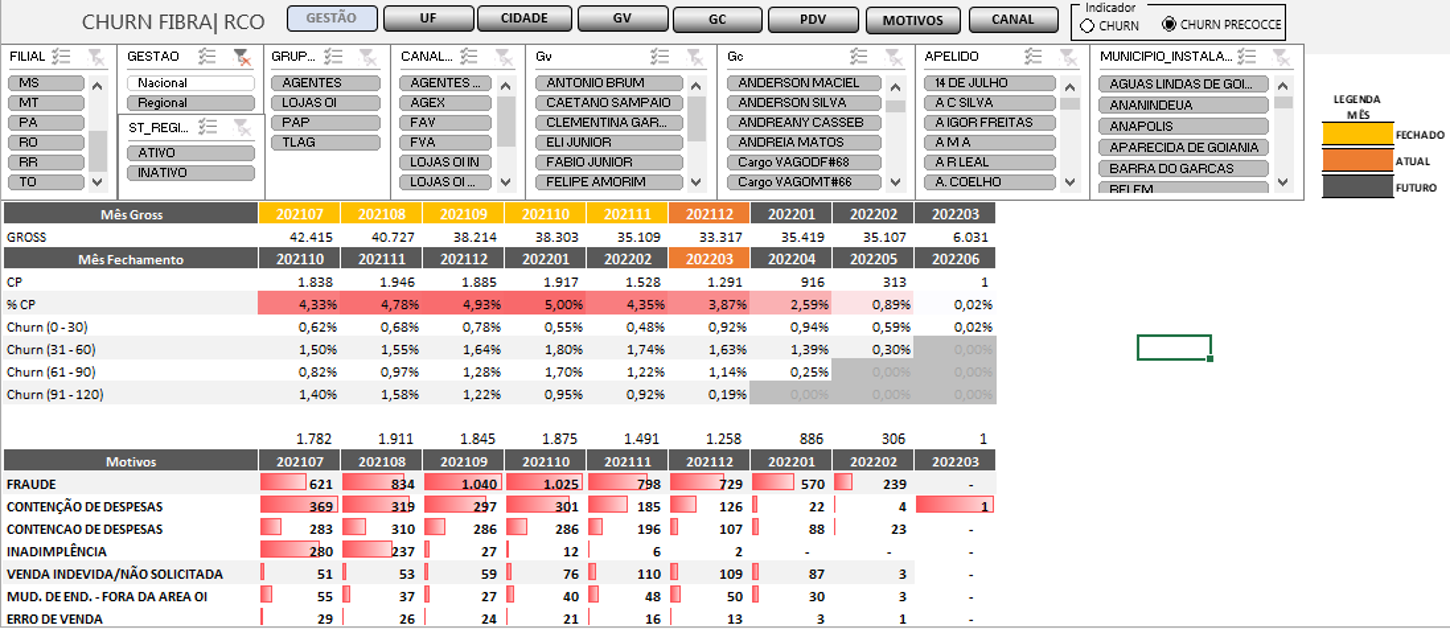
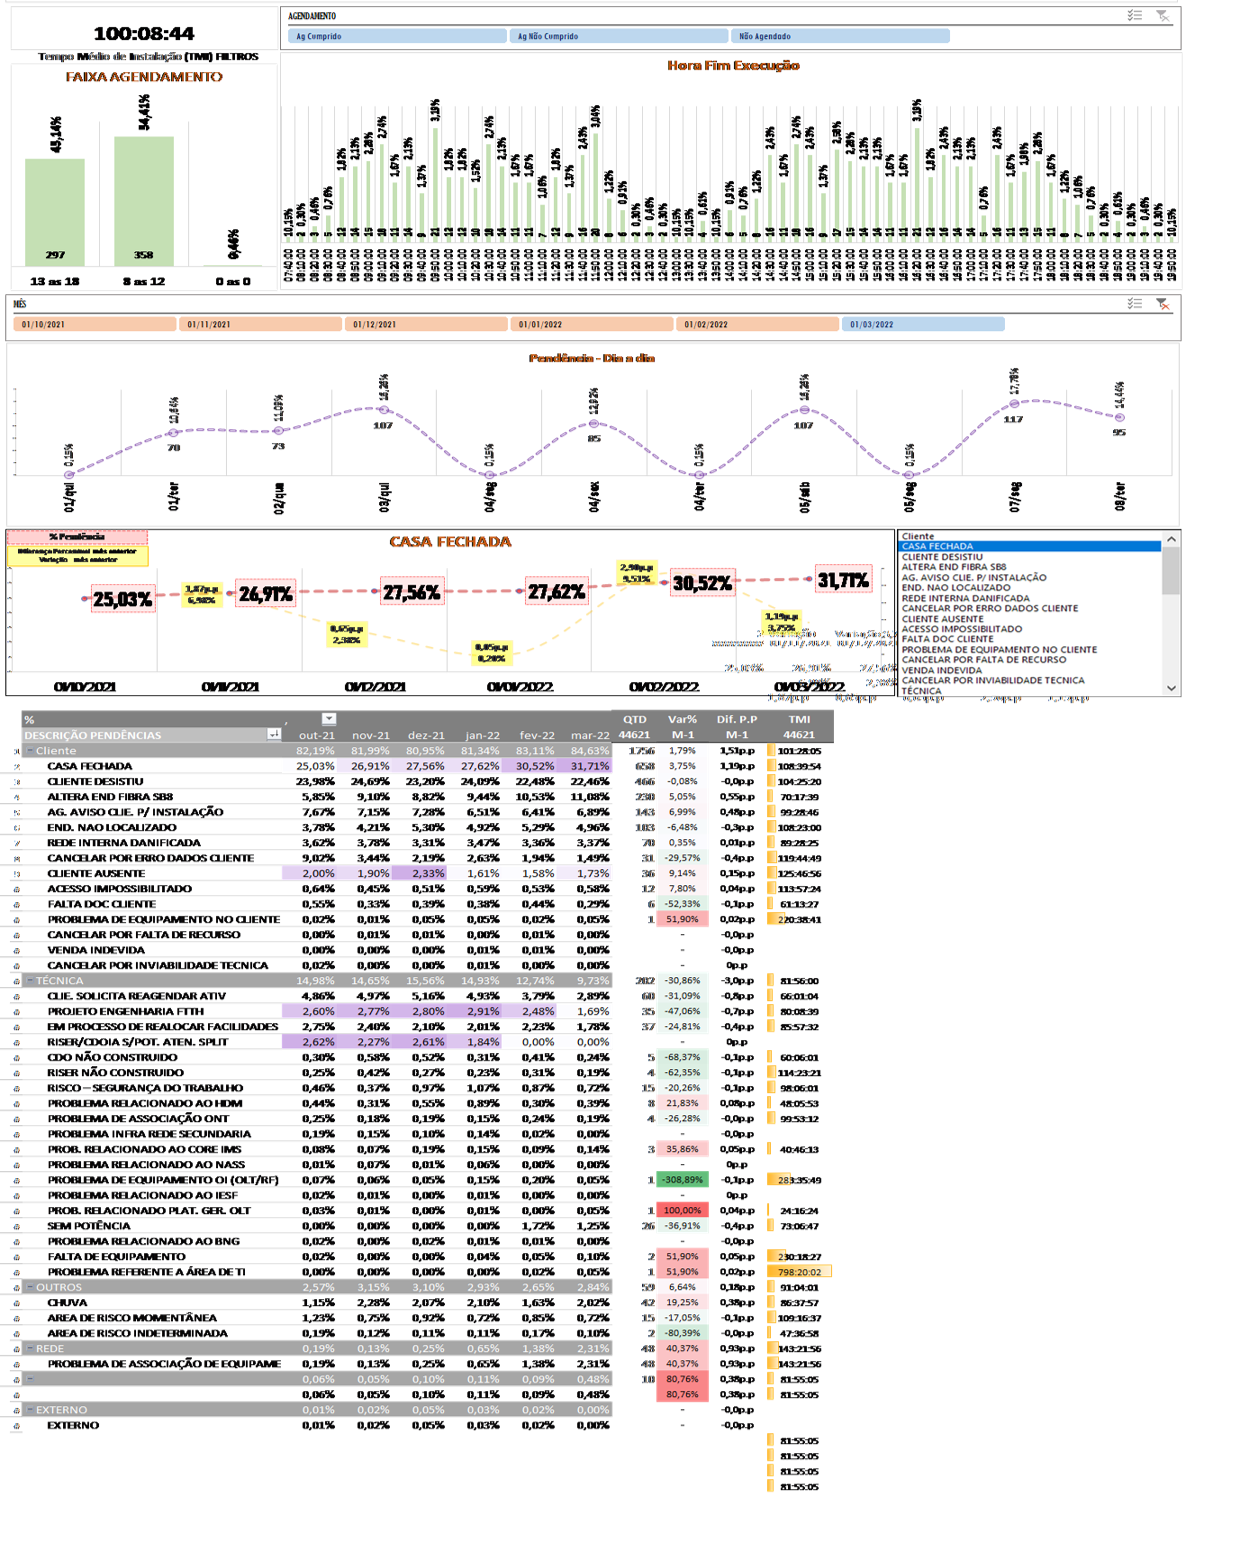
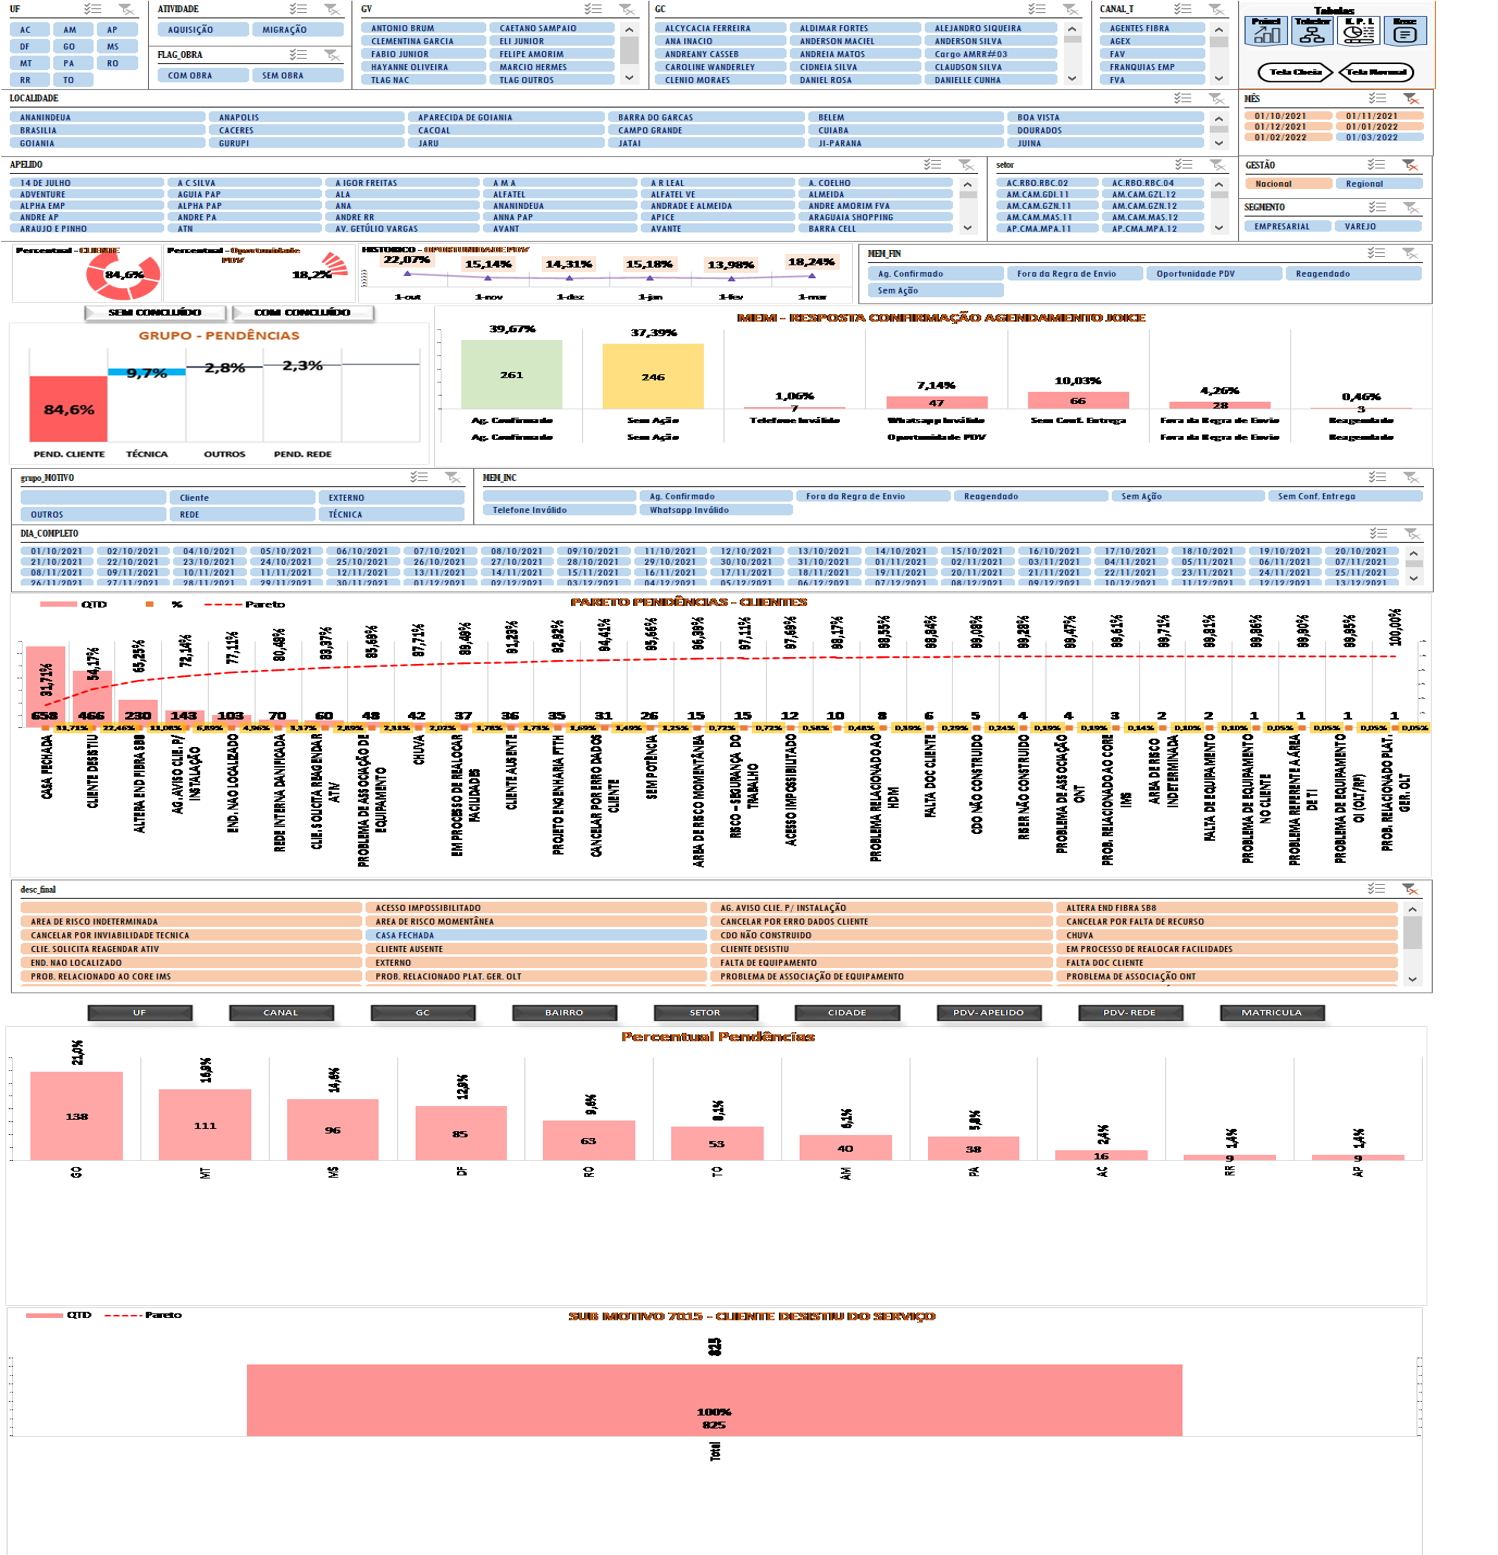
Qlik Sense and QlikView — set analysis–heavy expressions, master items, and drillable KPI grids. Delivery covers load scripts, governed reports, Qlik Automation for hand-offs, Section Access for row-level security, and both Sense and View stacks depending on the client landscape.
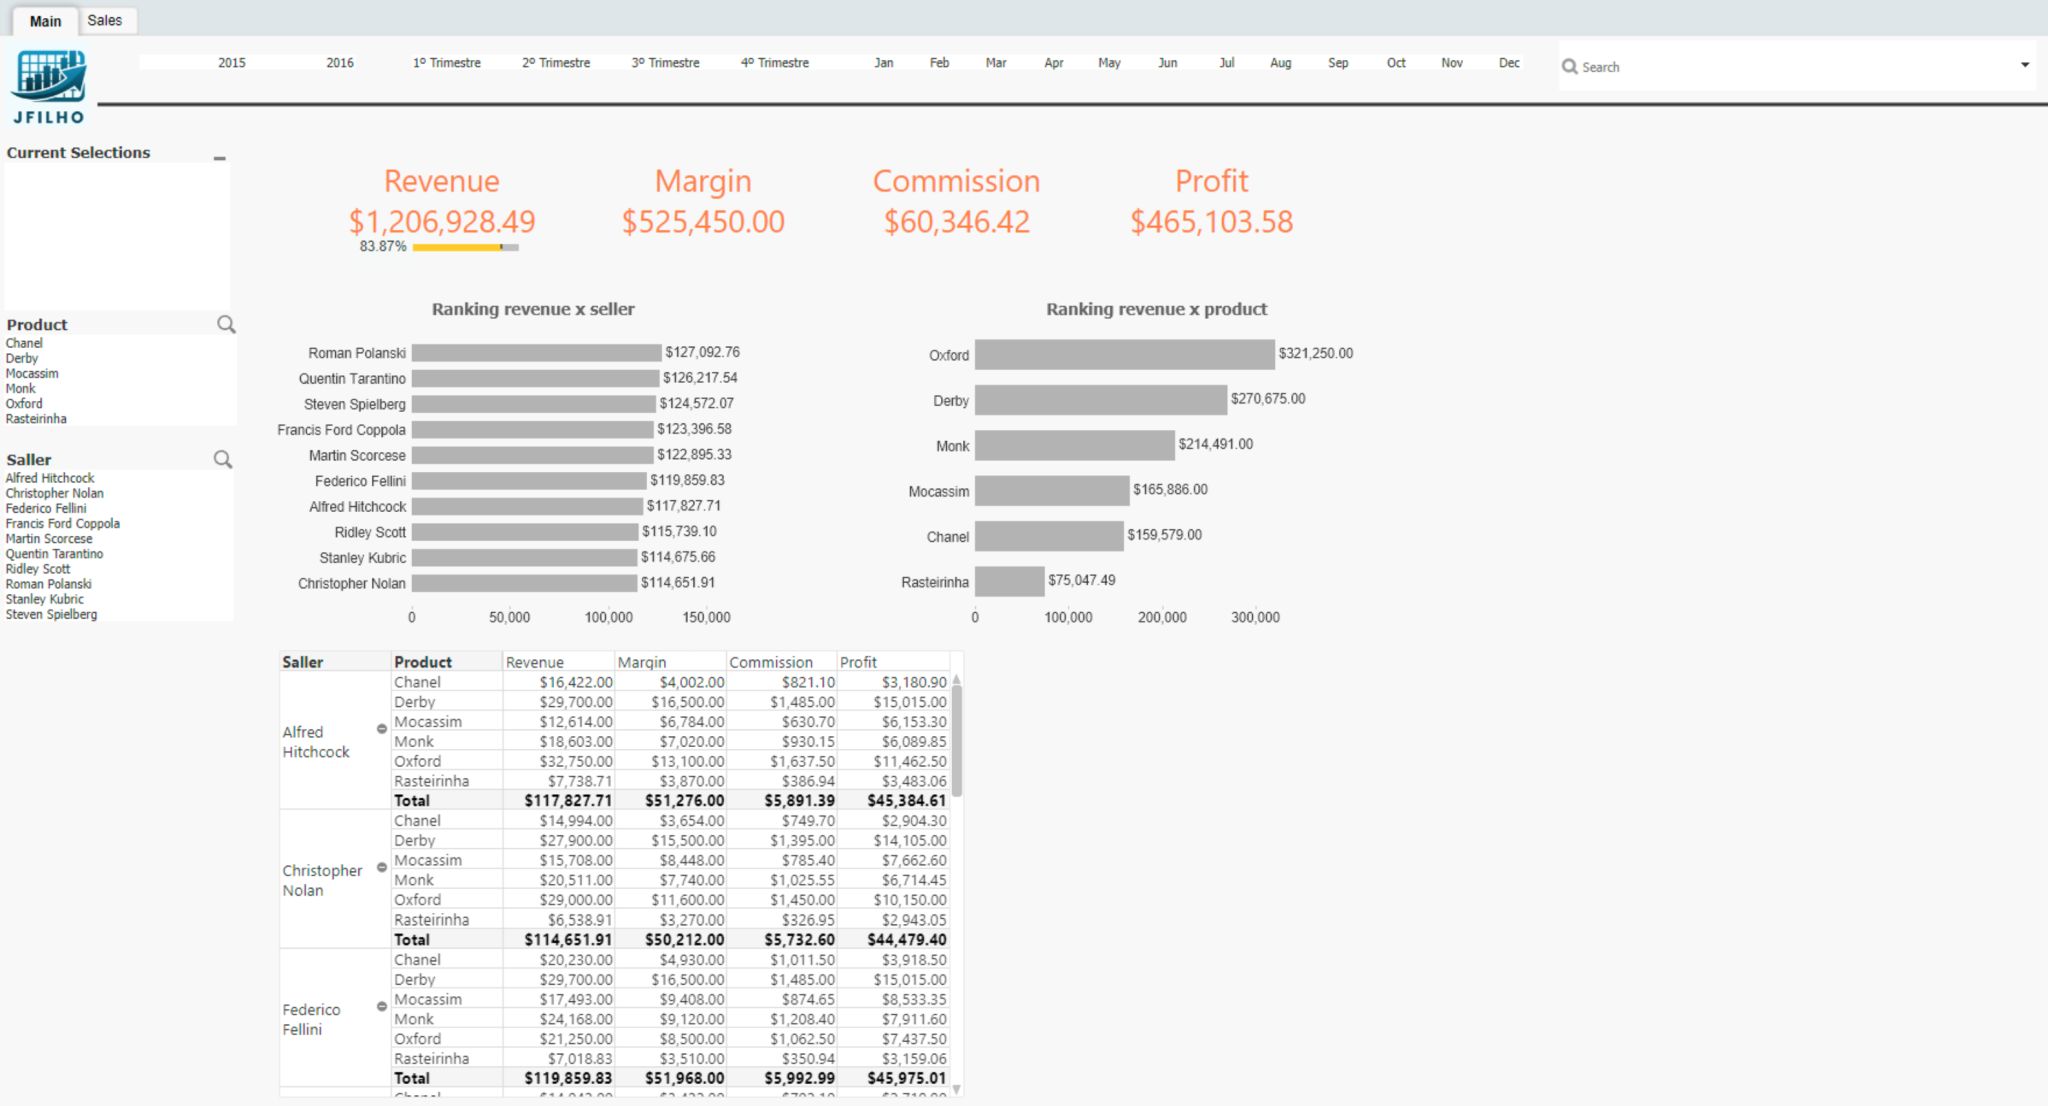
Related code: GitHub repository qlik-timeline-grid (same username as in the header).
Excel — advanced models, VBA (macros, user forms, event-driven sheets) for repeatable finance and ops tasks, Power Query–style shaping, and reporting packs that fed Power BI or stayed in spreadsheet-first workflows.

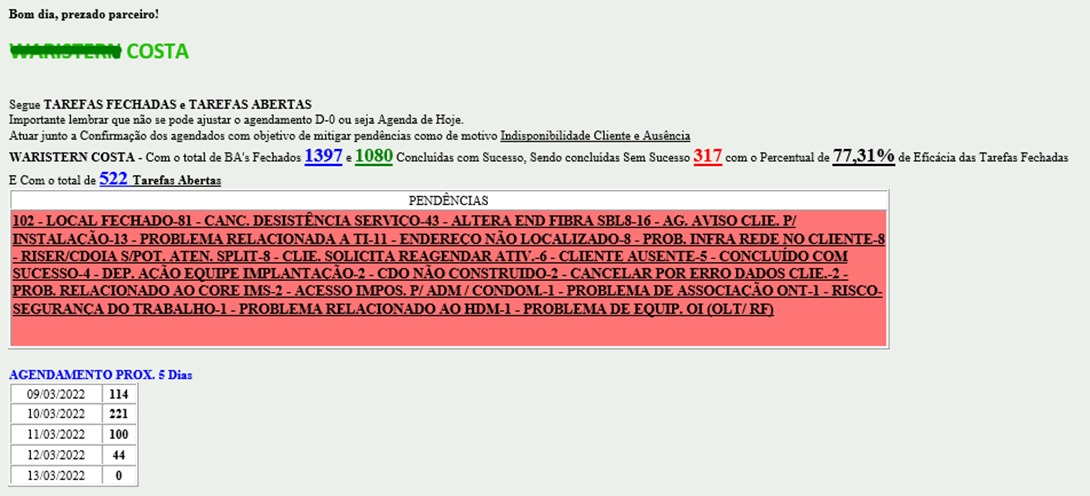
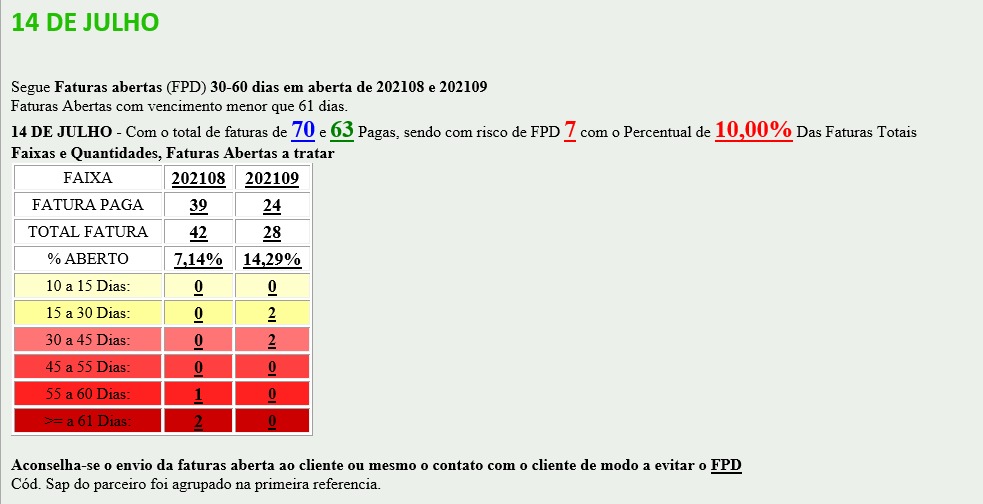
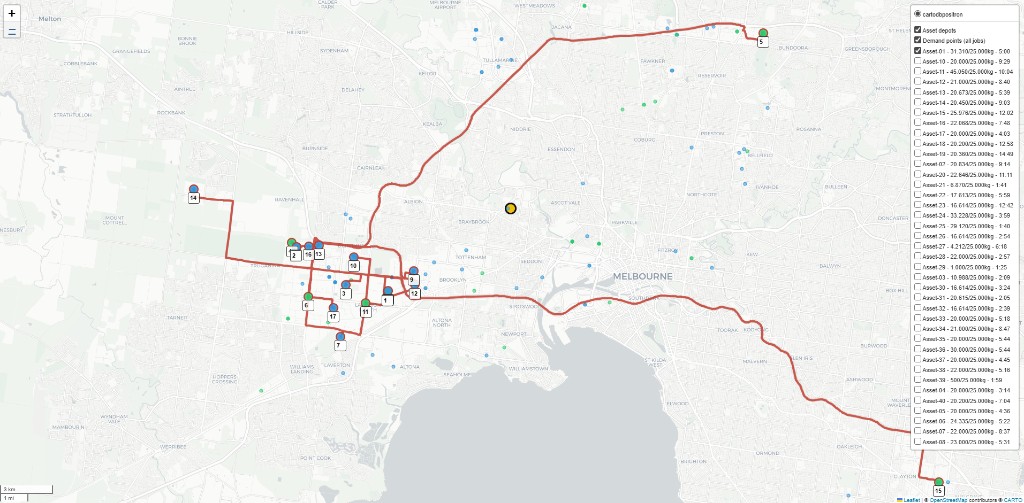
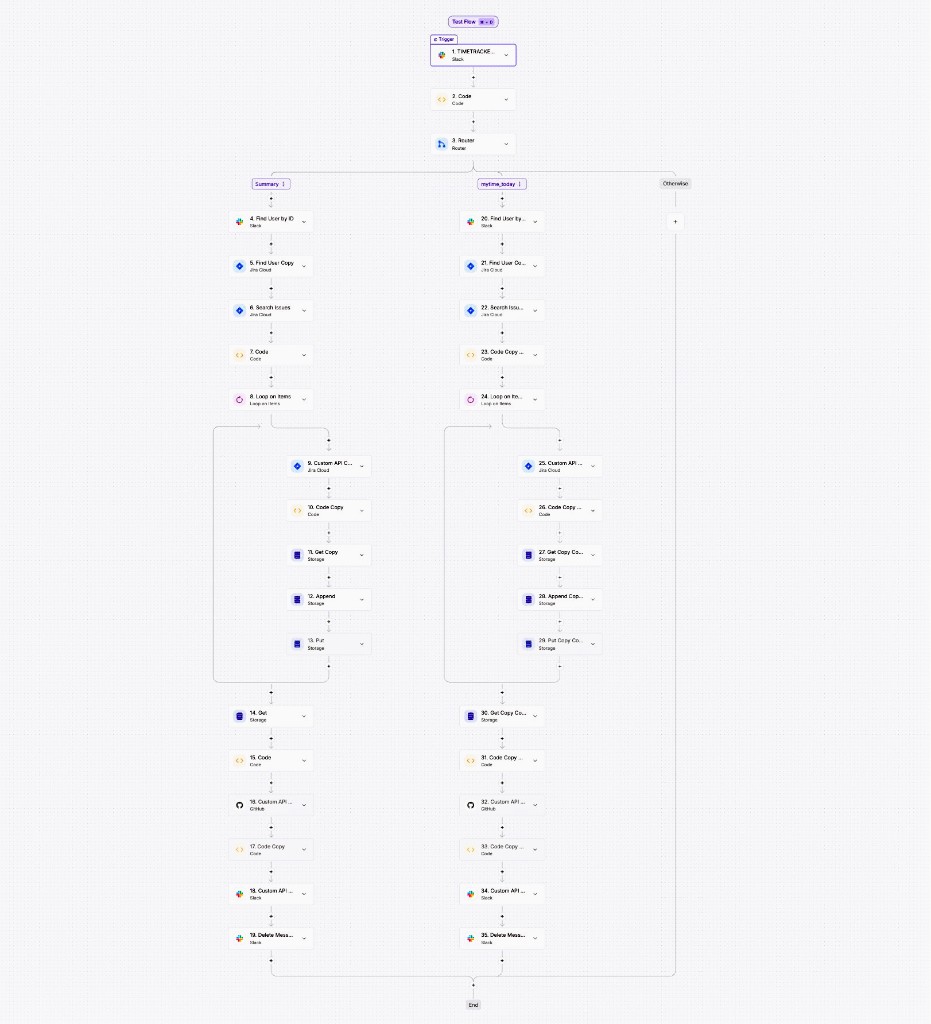
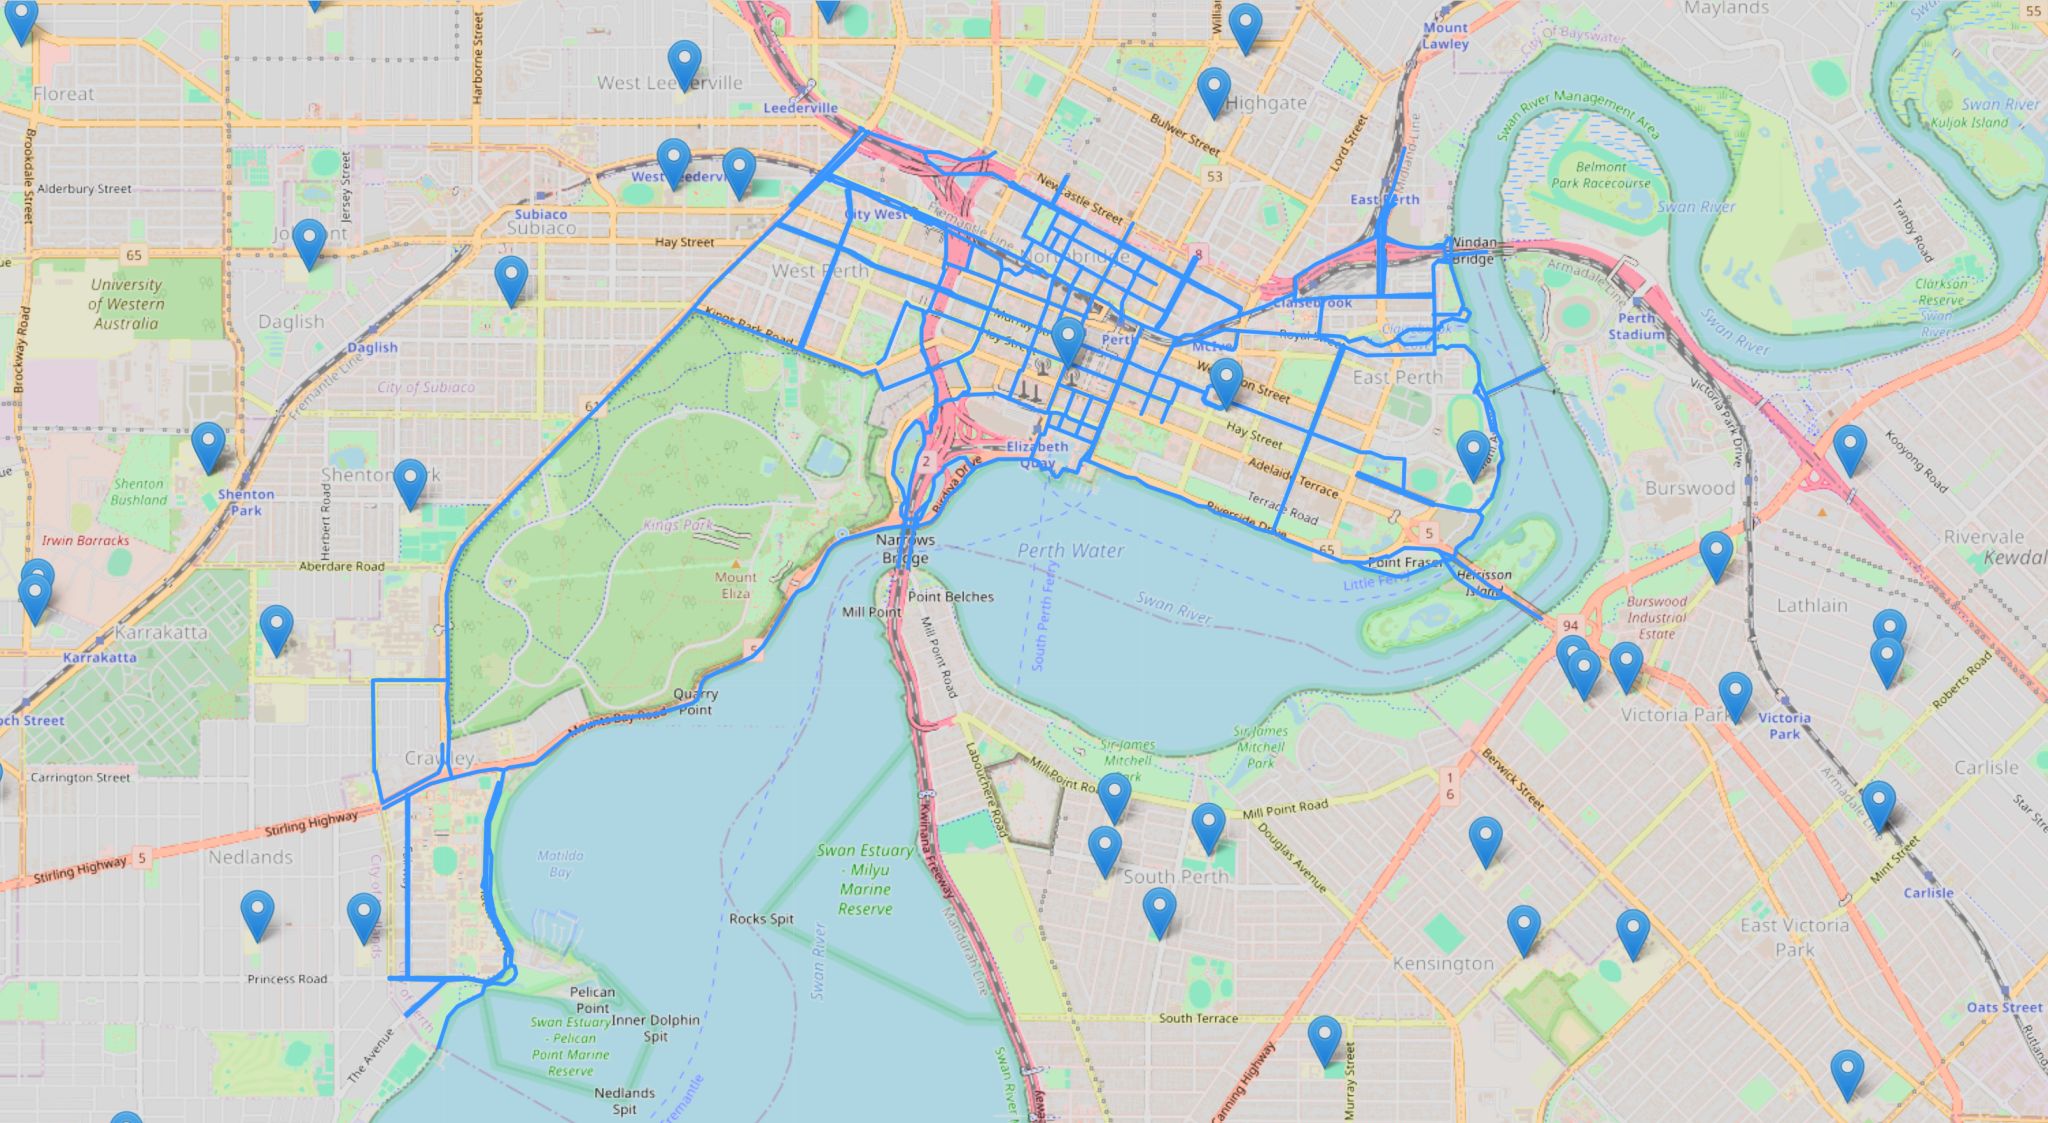
Work that sits outside a single BI stack: Git pipelines and clean repos, GitHub Actions, orchestration with Activepieces / n8n, plus AI assistants and RAG when answers need to stay grounded in your data and docs. Below: scripted KPI email cadence, a Leaflet logistics/route map (Melbourne area, assets and demand points), and a multi-branch automation canvas across Slack, Jira, and GitHub—room for more as the gallery grows.